Math Text Only 2
Test Section Summary
0 of 75 Questions completed
Questions:
Information
You have already completed the test section before. Hence you can not start it again.
Test Section is loading…
You must sign in or sign up to start the test section.
You must first complete the following:
Results
Results
Time has elapsed
Categories
- Interpreting Categorical and Quantitative Data 0%
- Interpreting Graphics 0%
- 1
- 2
- 3
- 4
- 5
- 6
- 7
- 8
- 9
- 10
- 11
- 12
- 13
- 14
- 15
- 16
- 17
- 18
- 19
- 20
- 21
- 22
- 23
- 24
- 25
- 26
- 27
- 28
- 29
- 30
- 31
- 32
- 33
- 34
- 35
- 36
- 37
- 38
- 39
- 40
- 41
- 42
- 43
- 44
- 45
- 46
- 47
- 48
- 49
- 50
- 51
- 52
- 53
- 54
- 55
- 56
- 57
- 58
- 59
- 60
- 61
- 62
- 63
- 64
- 65
- 66
- 67
- 68
- 69
- 70
- 71
- 72
- 73
- 74
- 75
- Current
- Review
- Answered
- Correct
- Incorrect
-
Question 1 of 75
1. Question
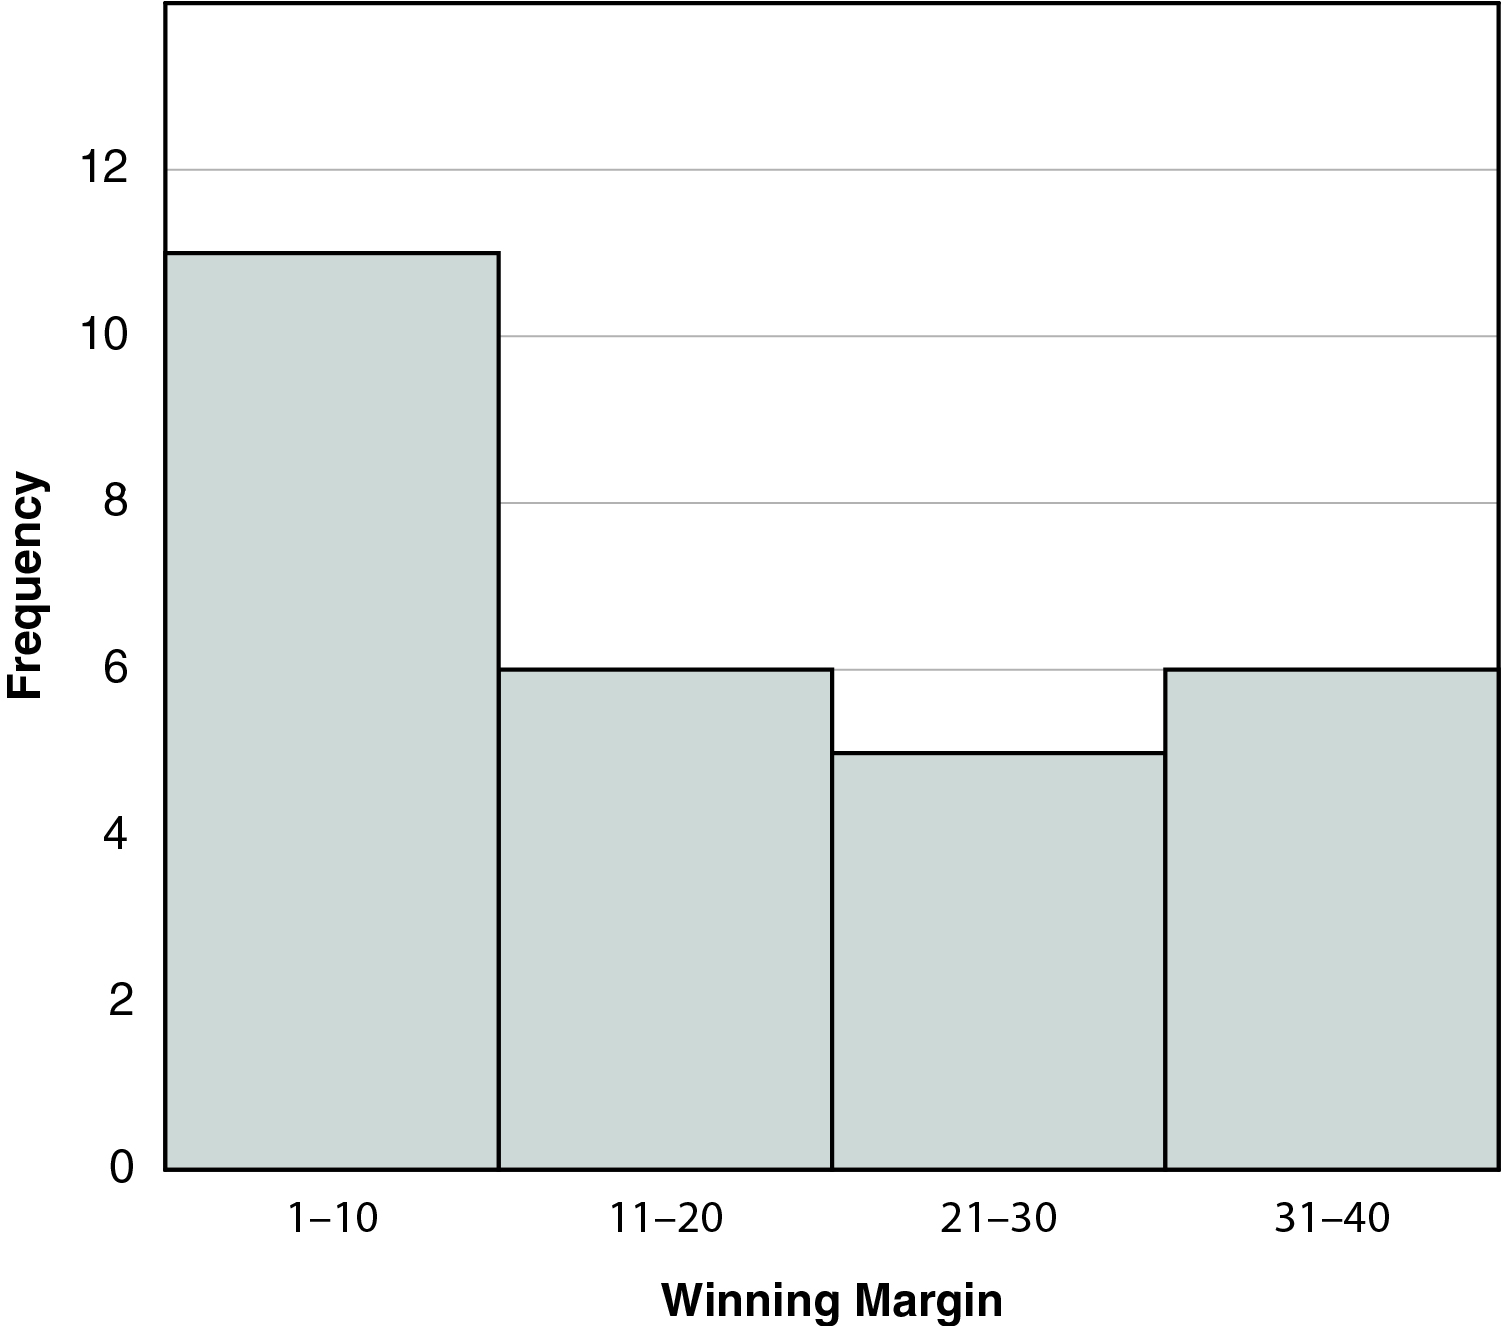
The histogram below shows a basketball team’s winning margin during the season. Which statement is true for the histogram?
 CorrectIncorrect
 -
Question 2 of 75
2. Question
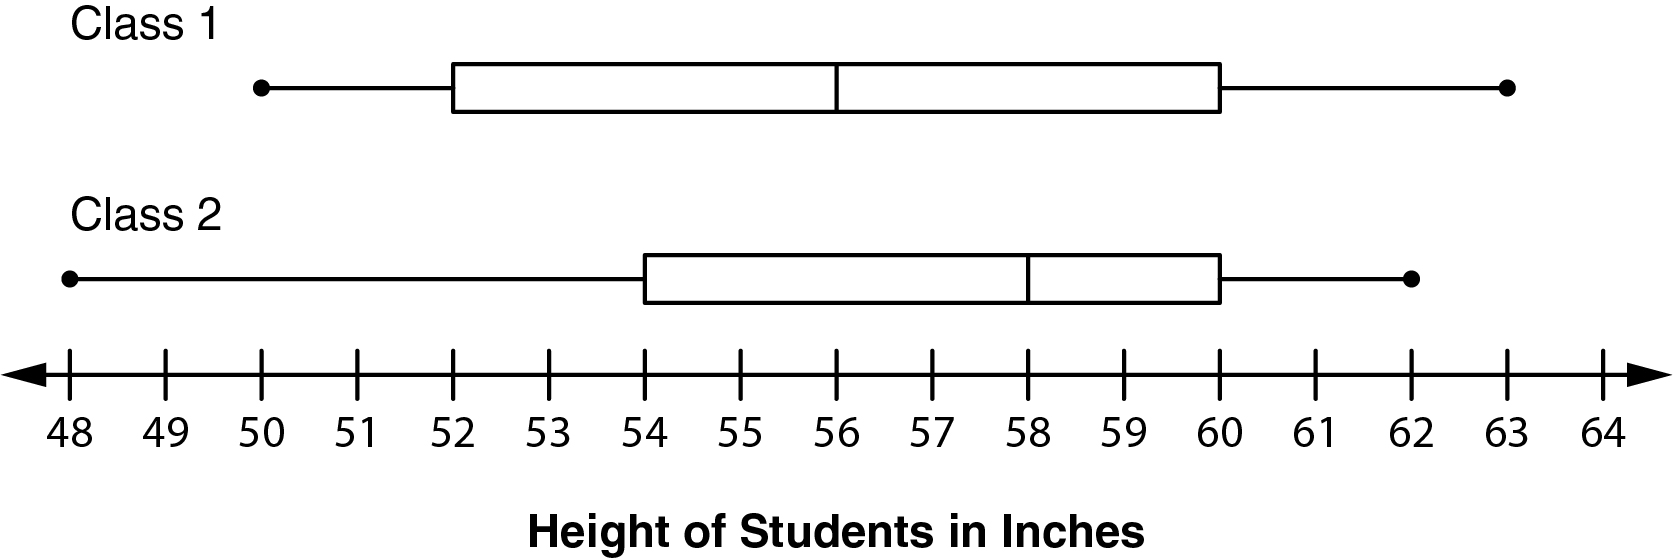
The box plots below show the heights of students in inches for two classes. Choose the statement that is true for the median and the interquartile range.
 CorrectIncorrect
 -
Question 3 of 75
3. Question
A little league basketball team scores 35, 38, 40, 36, 41, 42, 39, 35, 29, 32, 37, 33 in its first 12 games. In its next game, the team scores 12 points. Which statement describes the mean and standard deviation?
CorrectIncorrect -
Question 4 of 75
4. Question
A soccer team has scored 1, 1, 2, 2, 3, 3, 4, 4, 5 goals in its first 9 games. During the next game, the team scores 8 goals. Compare the mean and the standard deviation before and after the next game.
CorrectIncorrect -
Question 5 of 75
5. Question
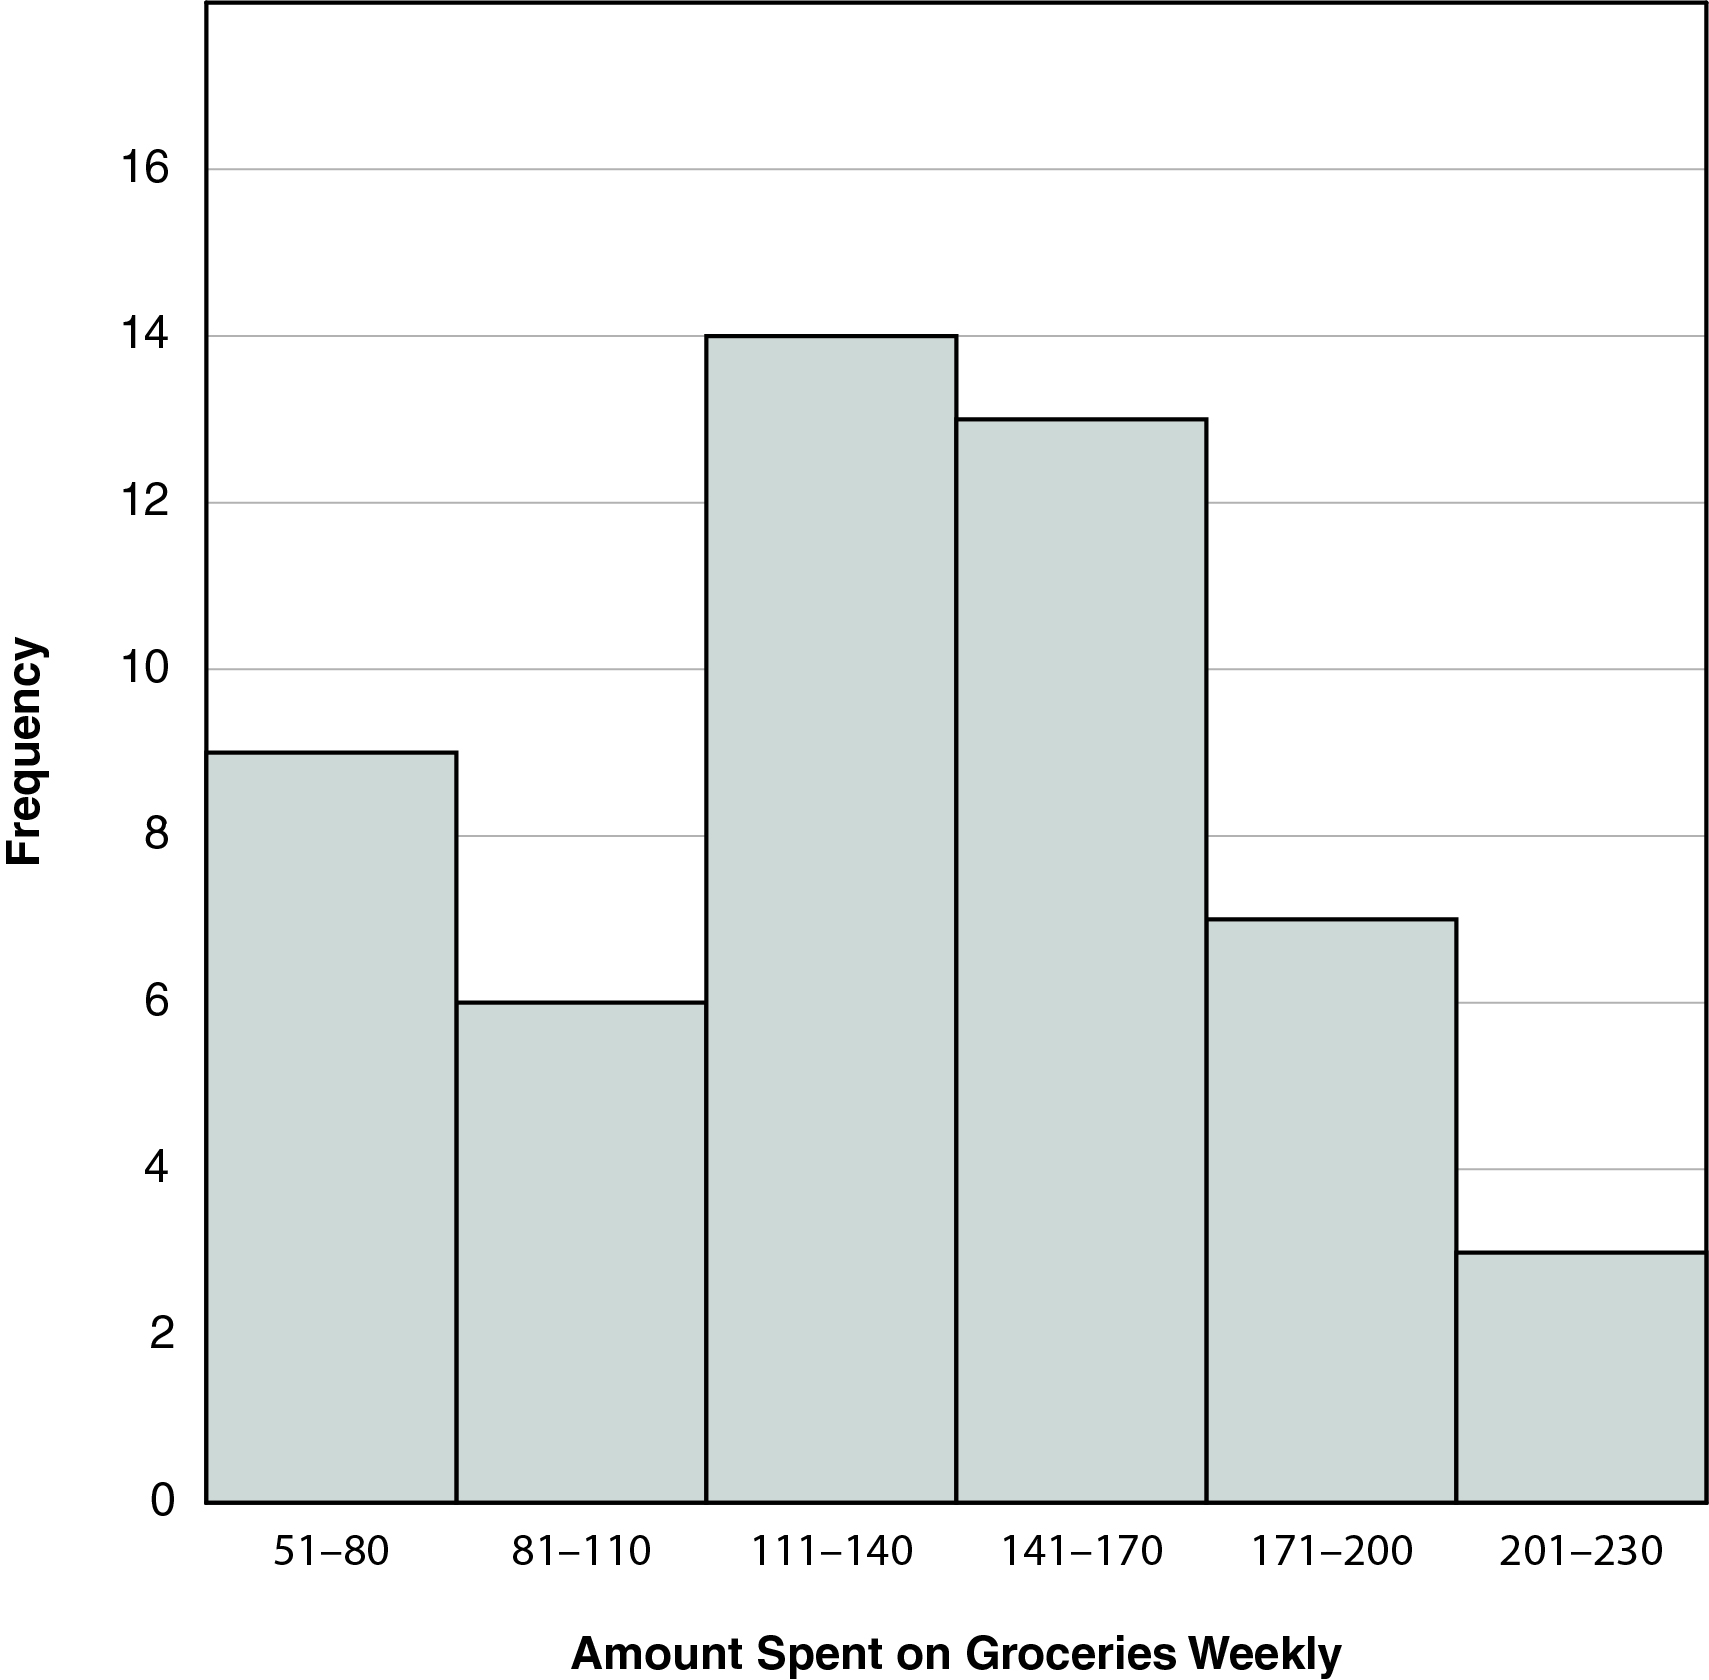
The histogram below shows the amount a family spent on groceries during the year. Which statement is true for the histogram?
 CorrectIncorrect
 -
Question 6 of 75
6. Question
The data below show the number of cars that drove through an intersection on a Saturday.
1, 48, 60, 43, 41, 70, 75, 80, 101, 90, 121, 114, 99, 153, 205, 175, 222, 96, 201, 158, 141, 117, 74
Select a histogram for the data.
CorrectIncorrect -
Question 7 of 75
7. Question
The data below shows the number of minutes available to eat breakfast for a group of employees.
10, 20, 40, 30, 50, 60, 50, 40, 30, 20, 40, 30, 10, 20, 30, 50, 40, 10, 10, 20, 30, 40, 20, 50, 40, 30
Select a dot plot for the data.
CorrectIncorrect -
Question 8 of 75
8. Question
The high temperatures in degrees Fahrenheit for the beginning of April are 45, 48, 53, 57, 52, 60, 58. The last temperature is 28.
Compare the standard deviation and interquartile range before and after the last temperature.
CorrectIncorrect -
Question 9 of 75
9. Question
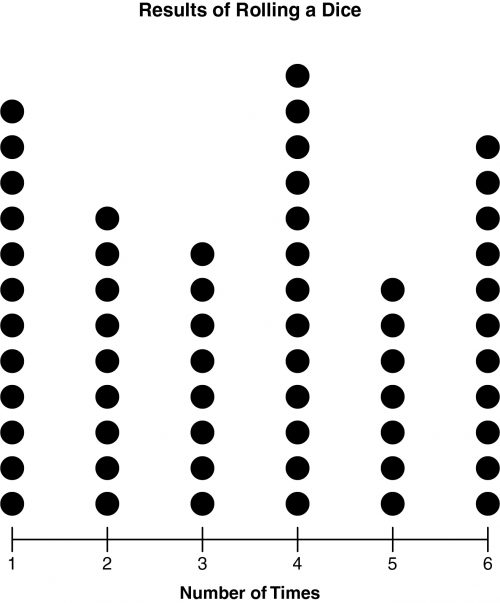
The dot plot shows the results of rolling a dice for a game. Which statement is true for the dot plot?
 CorrectIncorrect
 -
Question 10 of 75
10. Question
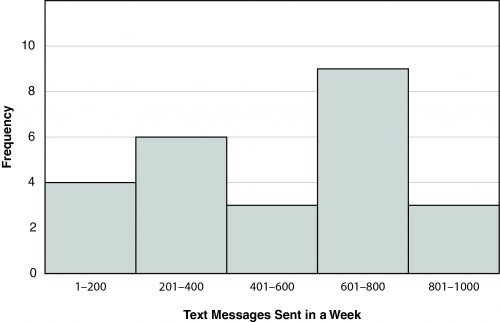
The histogram below shows the number of text messages between a group of friends in a week. Which statement is true for the histogram?
 CorrectIncorrect
 -
Question 11 of 75
11. Question
A basketball player scores 18, 17, 20, 23, 15, 24, 22, 28, 5. What is the effect of removing the outlier on the mean and standard deviation?
CorrectIncorrect -
Question 12 of 75
12. Question
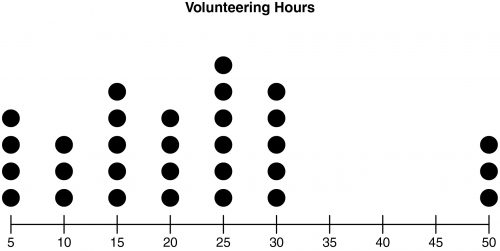
The dot plot shows the number of hours a group of students volunteered. How are the mean and median affected when removing the outliers?
 CorrectIncorrect
 -
Question 13 of 75
13. Question
The test scores in a class are 82, 83, 84, 84, 85, 86, 88, 89, 90. The last test is a score of 105. Compare the mean and median before and after the last test score is included.
CorrectIncorrect -
Question 14 of 75
14. Question
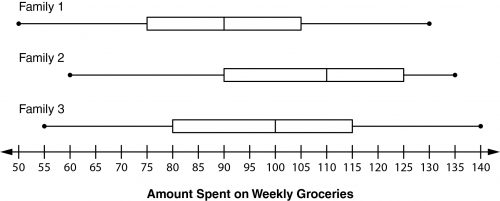
The box plot below shows the amount three families spent each week on groceries. Which statement describes the median and interquartile range?
 CorrectIncorrect
 -
Question 15 of 75
15. Question
The last 8 transactions at a shoe store in dollars are 5, 39, 49, 50, 52, 35, 44, 100. What is the effect of removing the outliers on the mean and median?
CorrectIncorrect -
Question 16 of 75
16. Question
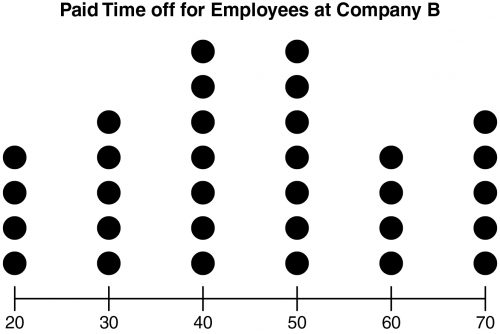
Two companies have made a chart of paid time off. Which statement describes the median and interquartile range?

 CorrectIncorrect
 -
Question 17 of 75
17. Question
The temperatures of two cities are shown for the first 10 days in February in degrees Fahrenheit.
City 1: 11, 12, 14, 15, 15, 16, 16, 17, 19, 20
City 2: 15, 15, 16, 17, 18, 18, 19, 20, 21, 21
Which statement describes the mean and standard deviation?
CorrectIncorrect -
Question 18 of 75
18. Question
Identify the variable from a study on cereal that is quantitative.
CorrectIncorrect -
Question 19 of 75
19. Question
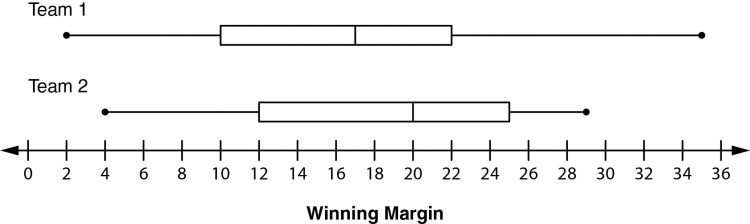
The box plot below shows the winning margin of two basketball teams during the season. Select the true statement about the interquartile range.
 CorrectIncorrect
 -
Question 20 of 75
20. Question
The wait times in minutes for the last 15 customers at a restaurant are as follows:
20, 17, 18, 15, 19, 45, 22, 18, 25, 28, 16, 19, 23, 20, 25
What is the effect of removing the outlier on the mean and median?
CorrectIncorrect -
Question 21 of 75
21. Question
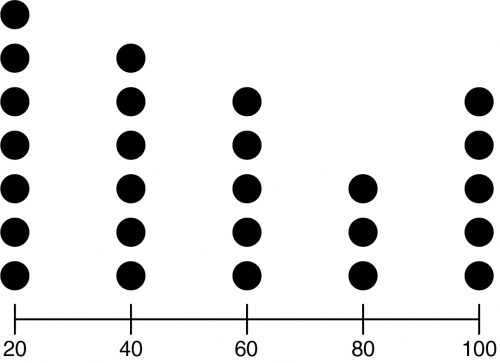
Find the median from the dot plot.
 CorrectIncorrect
 -
Question 22 of 75
22. Question
The list shows the commute time of workers on two different streets.
Street 1: 5, 5, 10, 10, 10, 15, 15, 15, 15, 15, 15, 20, 20, 20, 25, 25, 30, 30, 35, 40, 45
Street 2: 5, 10, 15, 15, 20, 20, 20, 20, 25, 25, 25, 30, 30, 30, 30, 30, 30, 35, 40, 45, 45
Which statement describes the median and interquartile range?
CorrectIncorrect -
Question 23 of 75
23. Question
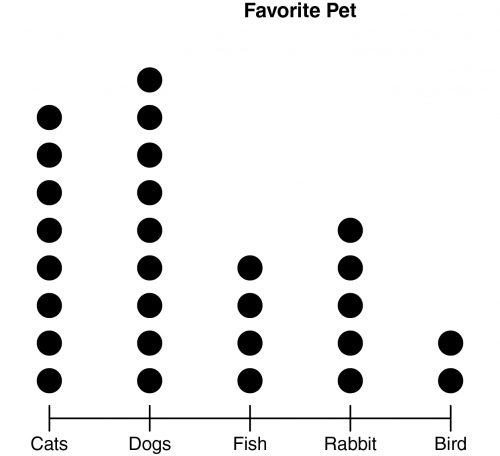
The dot plot shows the results of a favorite pet survey given to children. Each dot represents 5 respondents. Which statement is true for the dot plot?
 CorrectIncorrect
 -
Question 24 of 75
24. Question
Identify the variable from a census study that is categorical.
CorrectIncorrect -
Question 25 of 75
25. Question
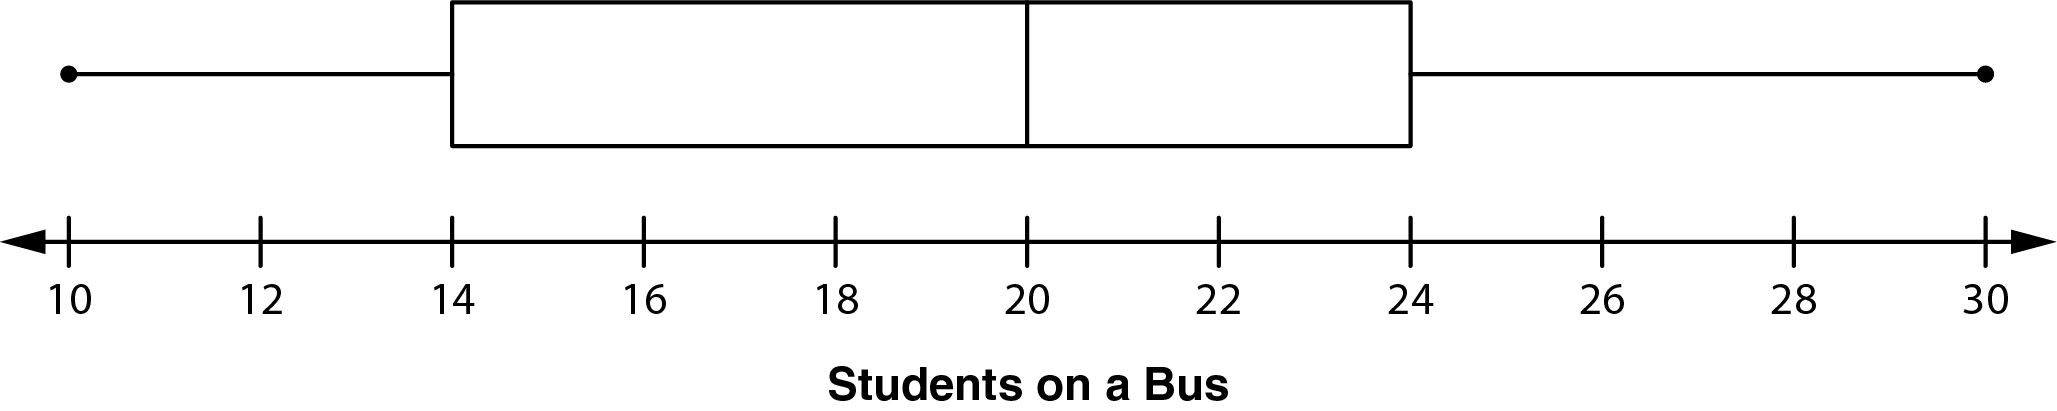
The box plot shows the number of students taking different busses to school. Which statement is true for the box plot?
 CorrectIncorrect
 -
Question 26 of 75
26. Question
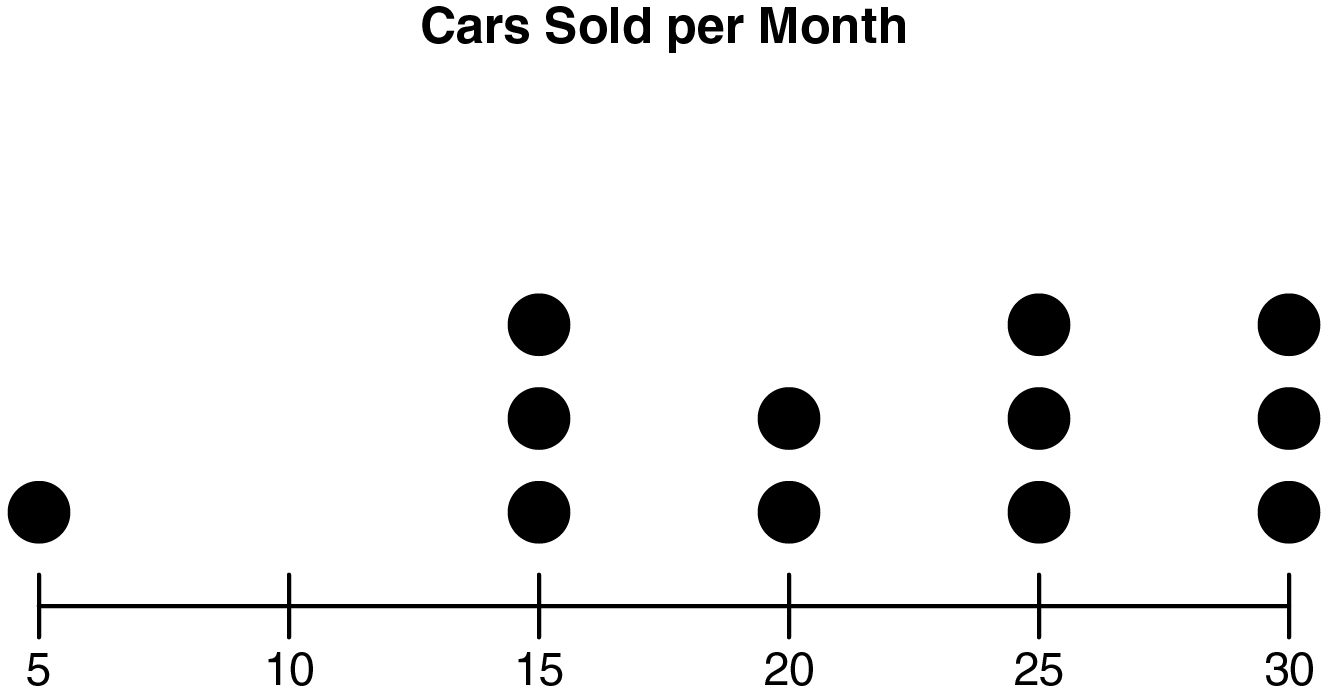
The dot plot shows the number of cars sold in a month. How are the median and interquartile range affected when removing the outlier?
 CorrectIncorrect
 -
Question 27 of 75
27. Question
Three bands on a tour have documented their ticket sales.
Band 1: Mean: 13,500, Standard Deviation: 1,000
Band 2: Mean: 14,250, Standard Deviation: 500
Band 3: Mean 12,500, Standard Deviation: 1,500<?p>
Which statement best describes the mean and standard deviation?
CorrectIncorrect -
Question 28 of 75
28. Question
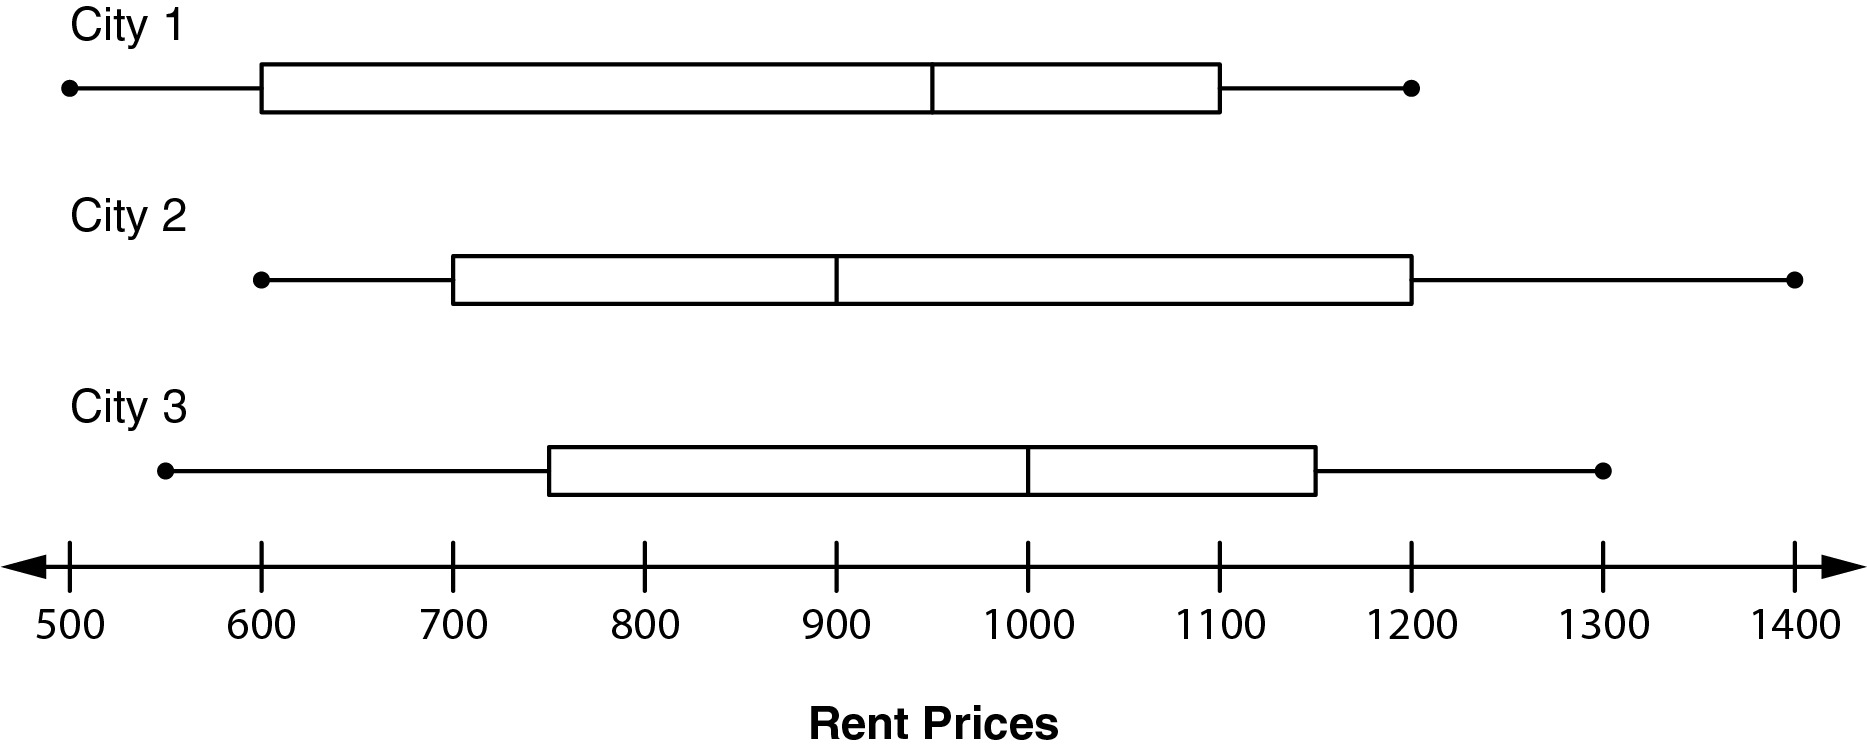
The box plot shows the rent prices for three different cities. List the median price of each city from greatest to least.
 CorrectIncorrect
 -
Question 29 of 75
29. Question
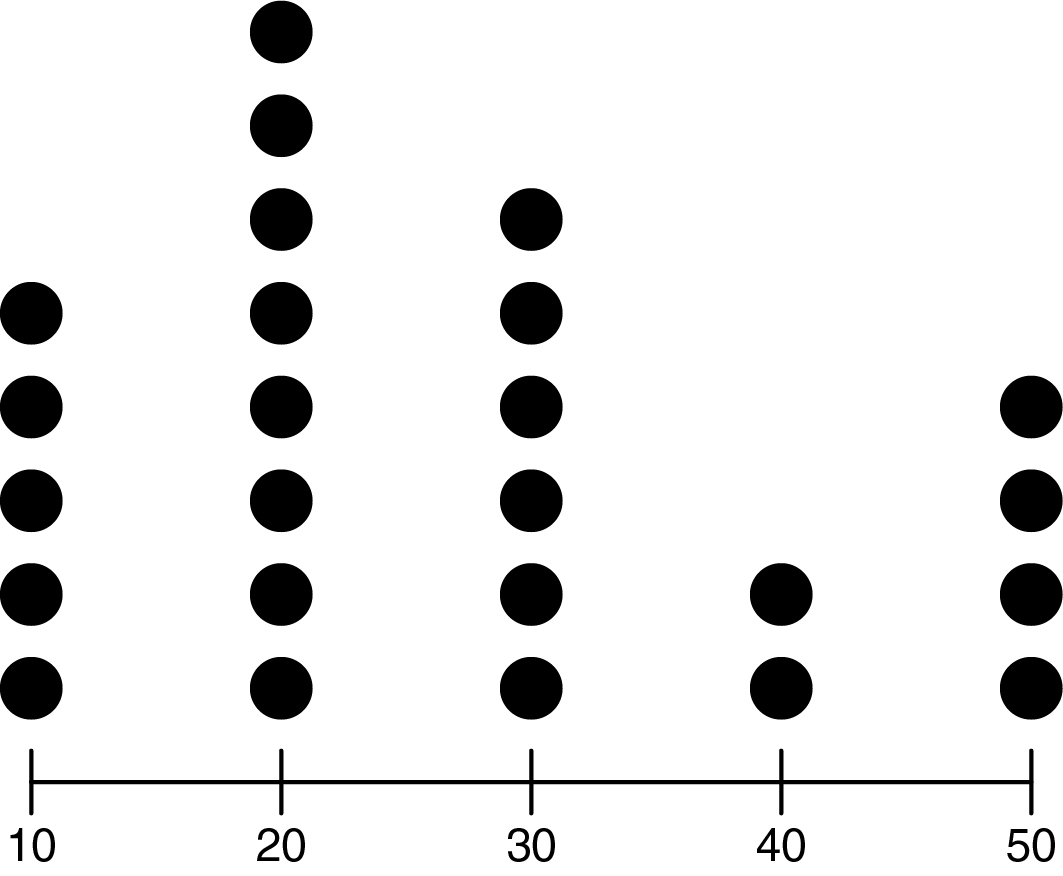
Find the mean from the dot plot.
 CorrectIncorrect
 -
Question 30 of 75
30. Question
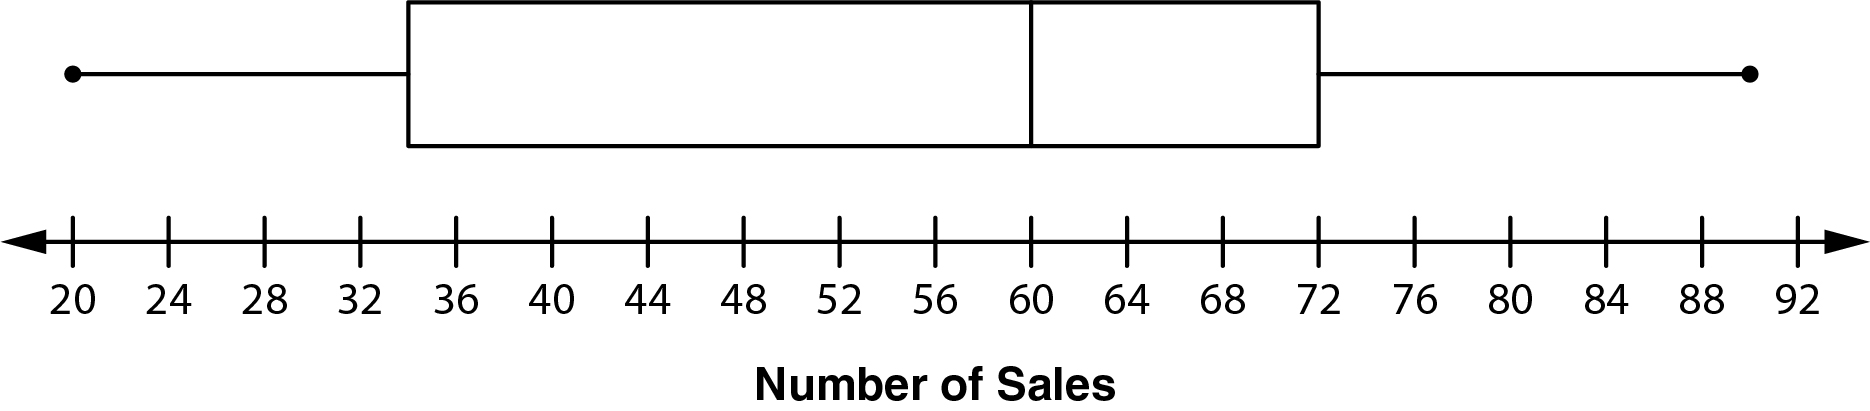
The box plot shows the number of weekly sales by a business during the year. Which statement is true for the box plot?
 CorrectIncorrect
 -
Question 31 of 75
31. Question
Students were surveyed about their favorite pet, and the table shows the results. Select the bar graph that represents this data.
Pet
Quantity
Dog
14
Cat
16
Fish
4
Bird
8
Gerbil
7
Pig
3
CorrectIncorrect -
Question 32 of 75
32. Question
The table shows the amount of rainfall in inches. Select the line graph that represents this data.
Day
1
2
3
4
5
6
7
8
9
10
11
12
Rainfall Amount
0.5
0.2
0.4
1.1
1.6
0.9
0.7
1.3
1.5
0.8
0.5
0.1
CorrectIncorrect -
Question 33 of 75
33. Question
The table shows the amount a family spends each month. Select the circle graph that represents the data.
Item
Food/Household Items
Bills
Mortgage
Savings
Miscellaneous
Amount
$700
$600
$400
$200
$100
CorrectIncorrect -
Question 34 of 75
34. Question
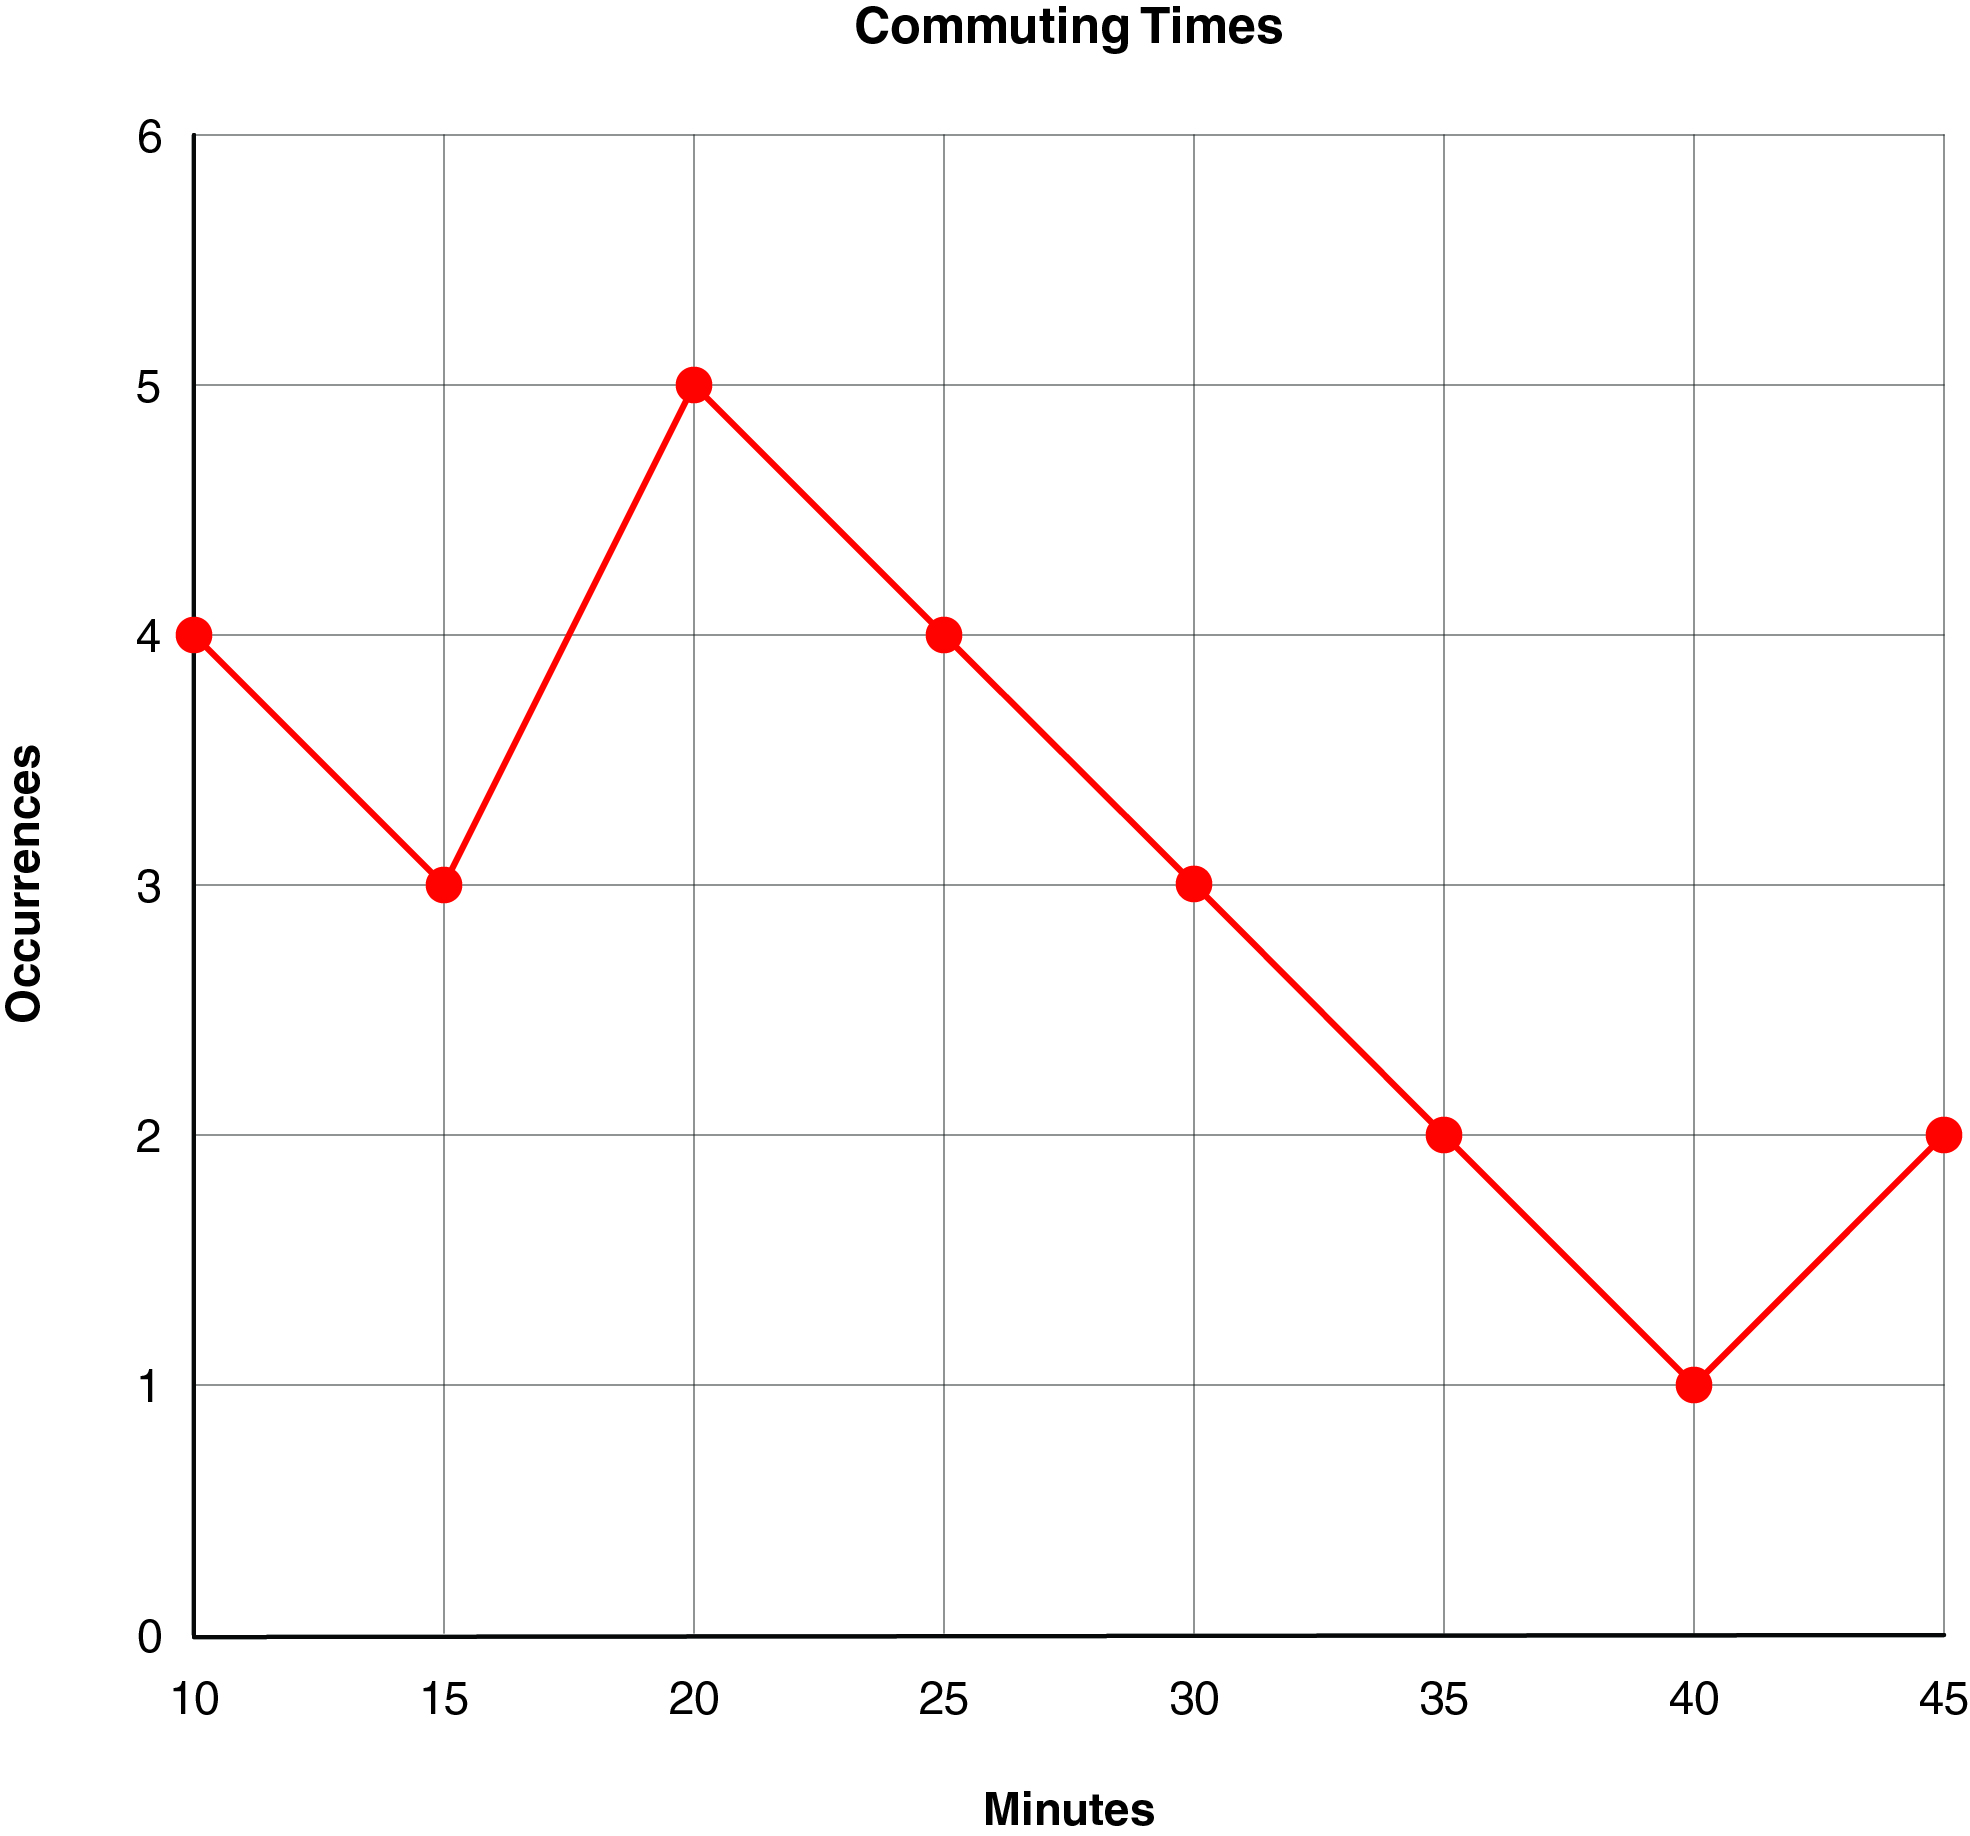
The line chart shows the number of minutes a commuter drove to work during a month. Which statement is true for the line chart?
 CorrectIncorrect
 -
Question 35 of 75
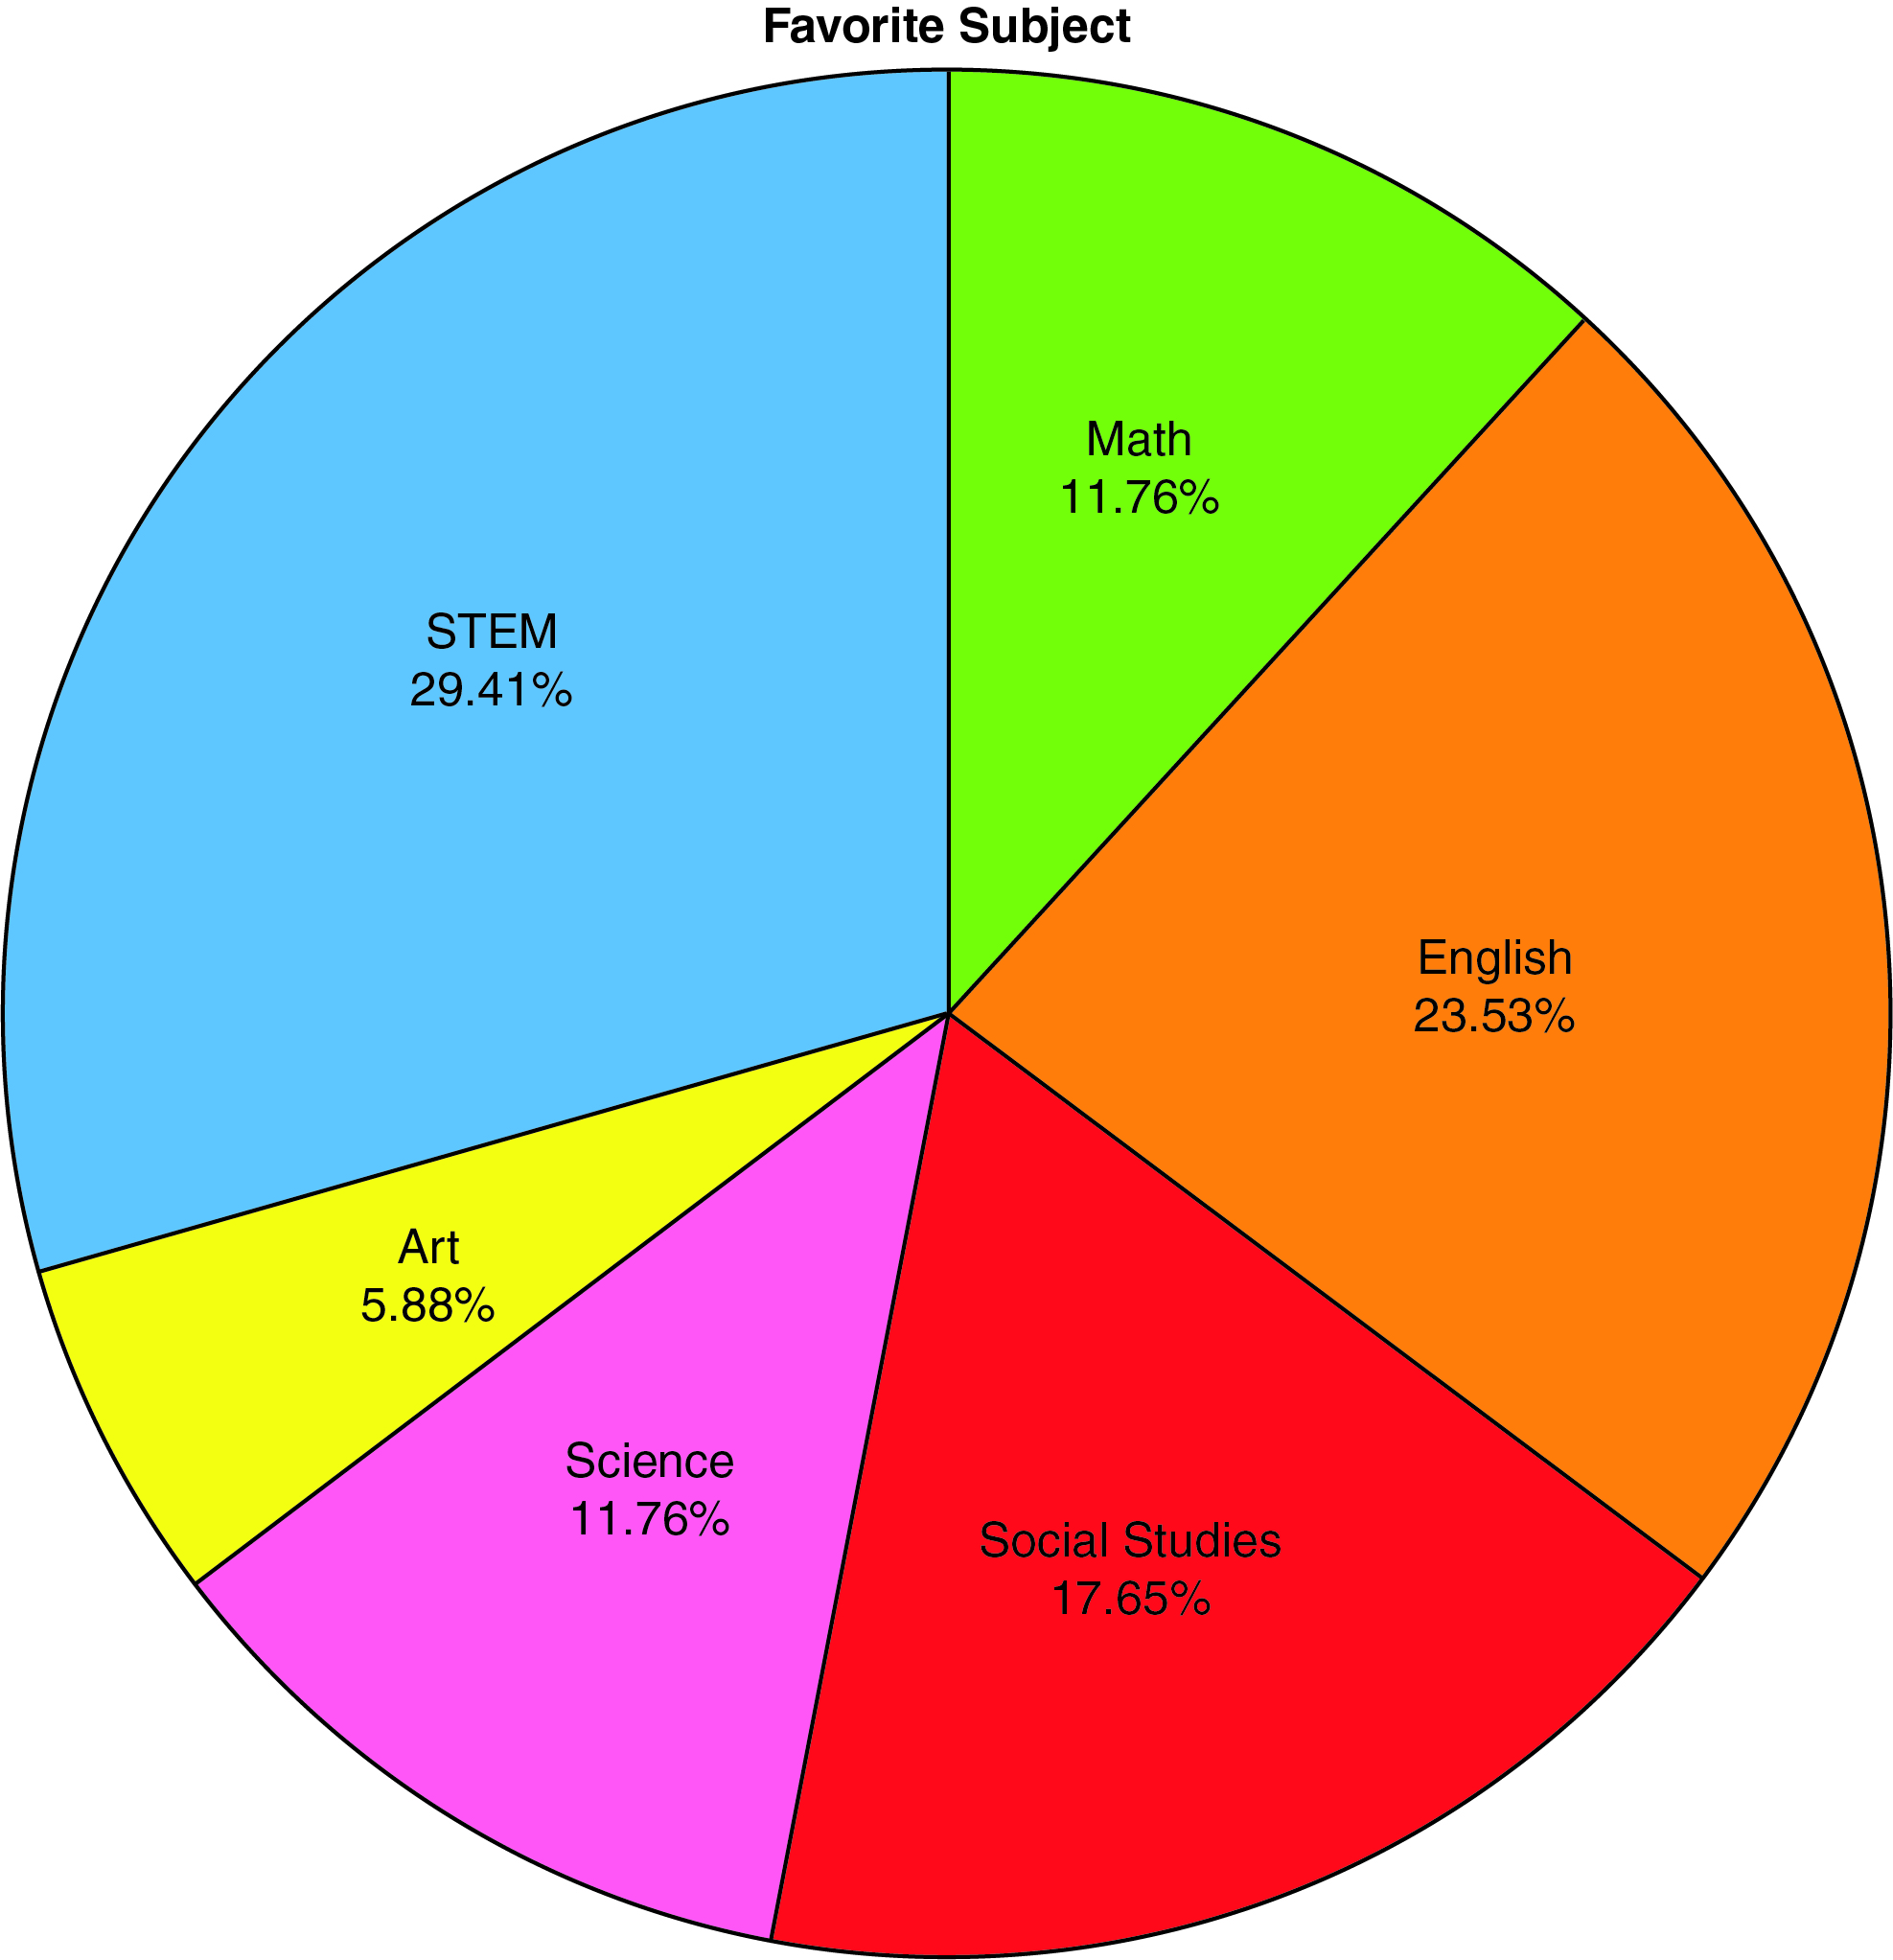
35. Question
Students were interviewed about their favorite subject in school. The circle graph shows the results. Which statement is true for the circle graph?
 CorrectIncorrect
 -
Question 36 of 75
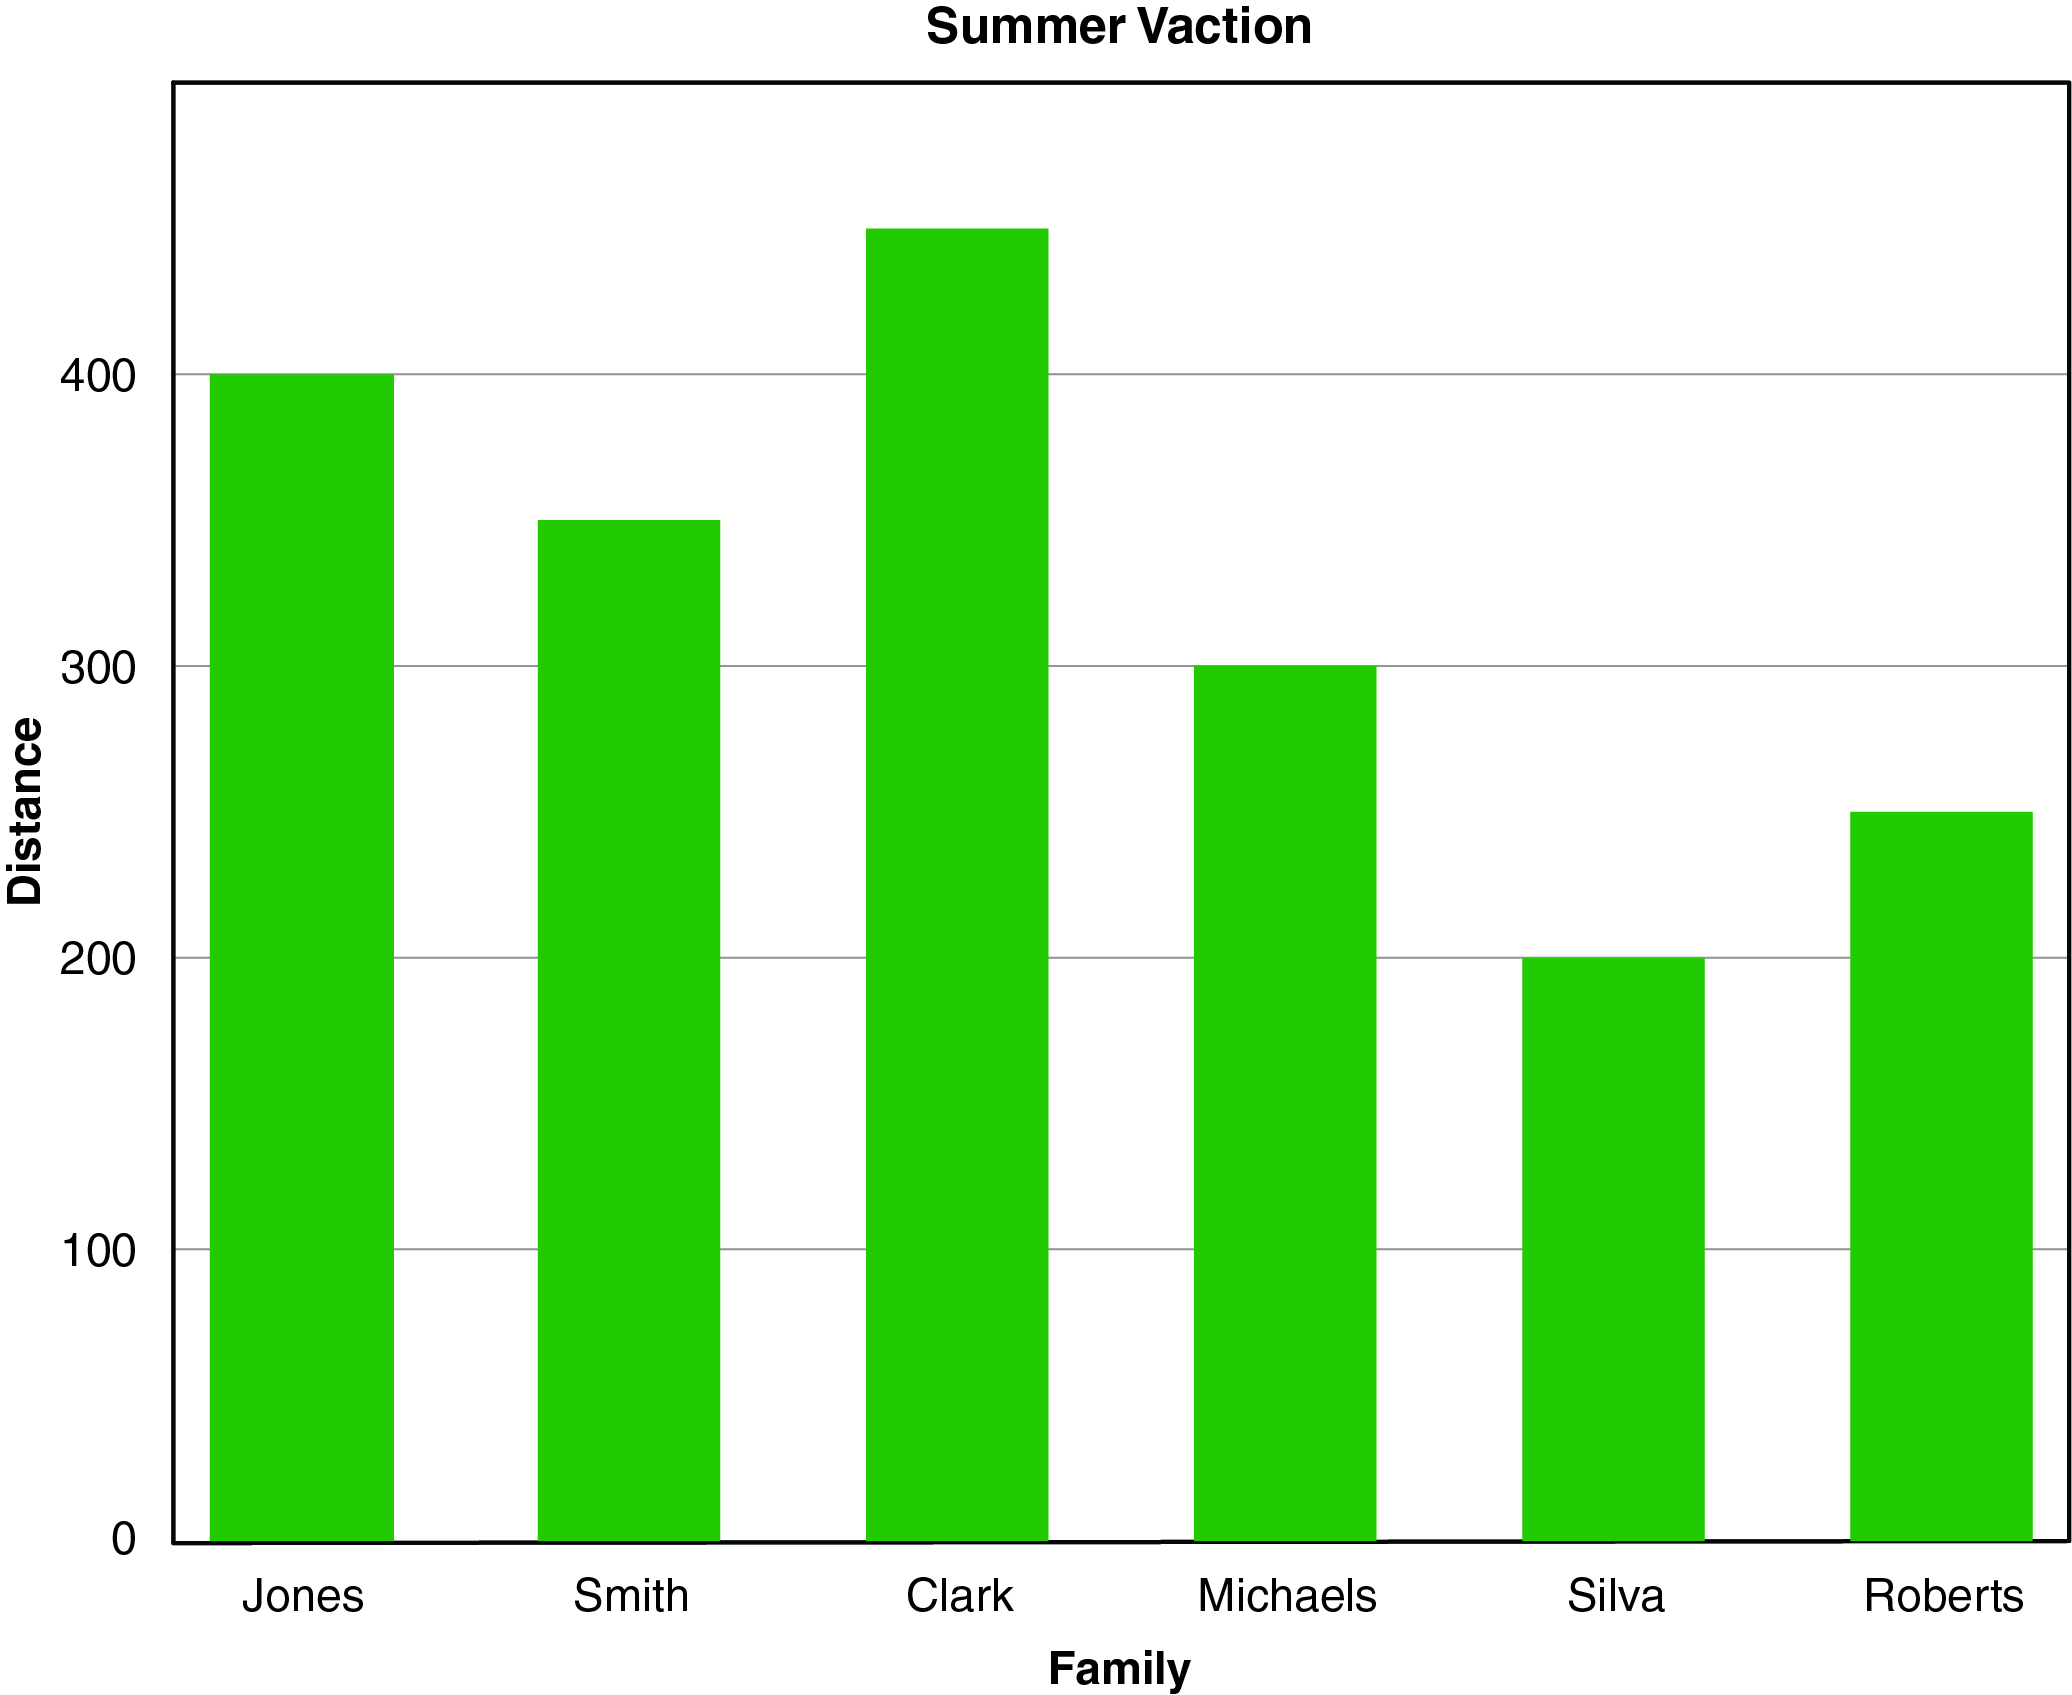
36. Question
The bar chart shows the distance different families traveled for summer vacation. Which statement is true for the bar chart?
 CorrectIncorrect
 -
Question 37 of 75
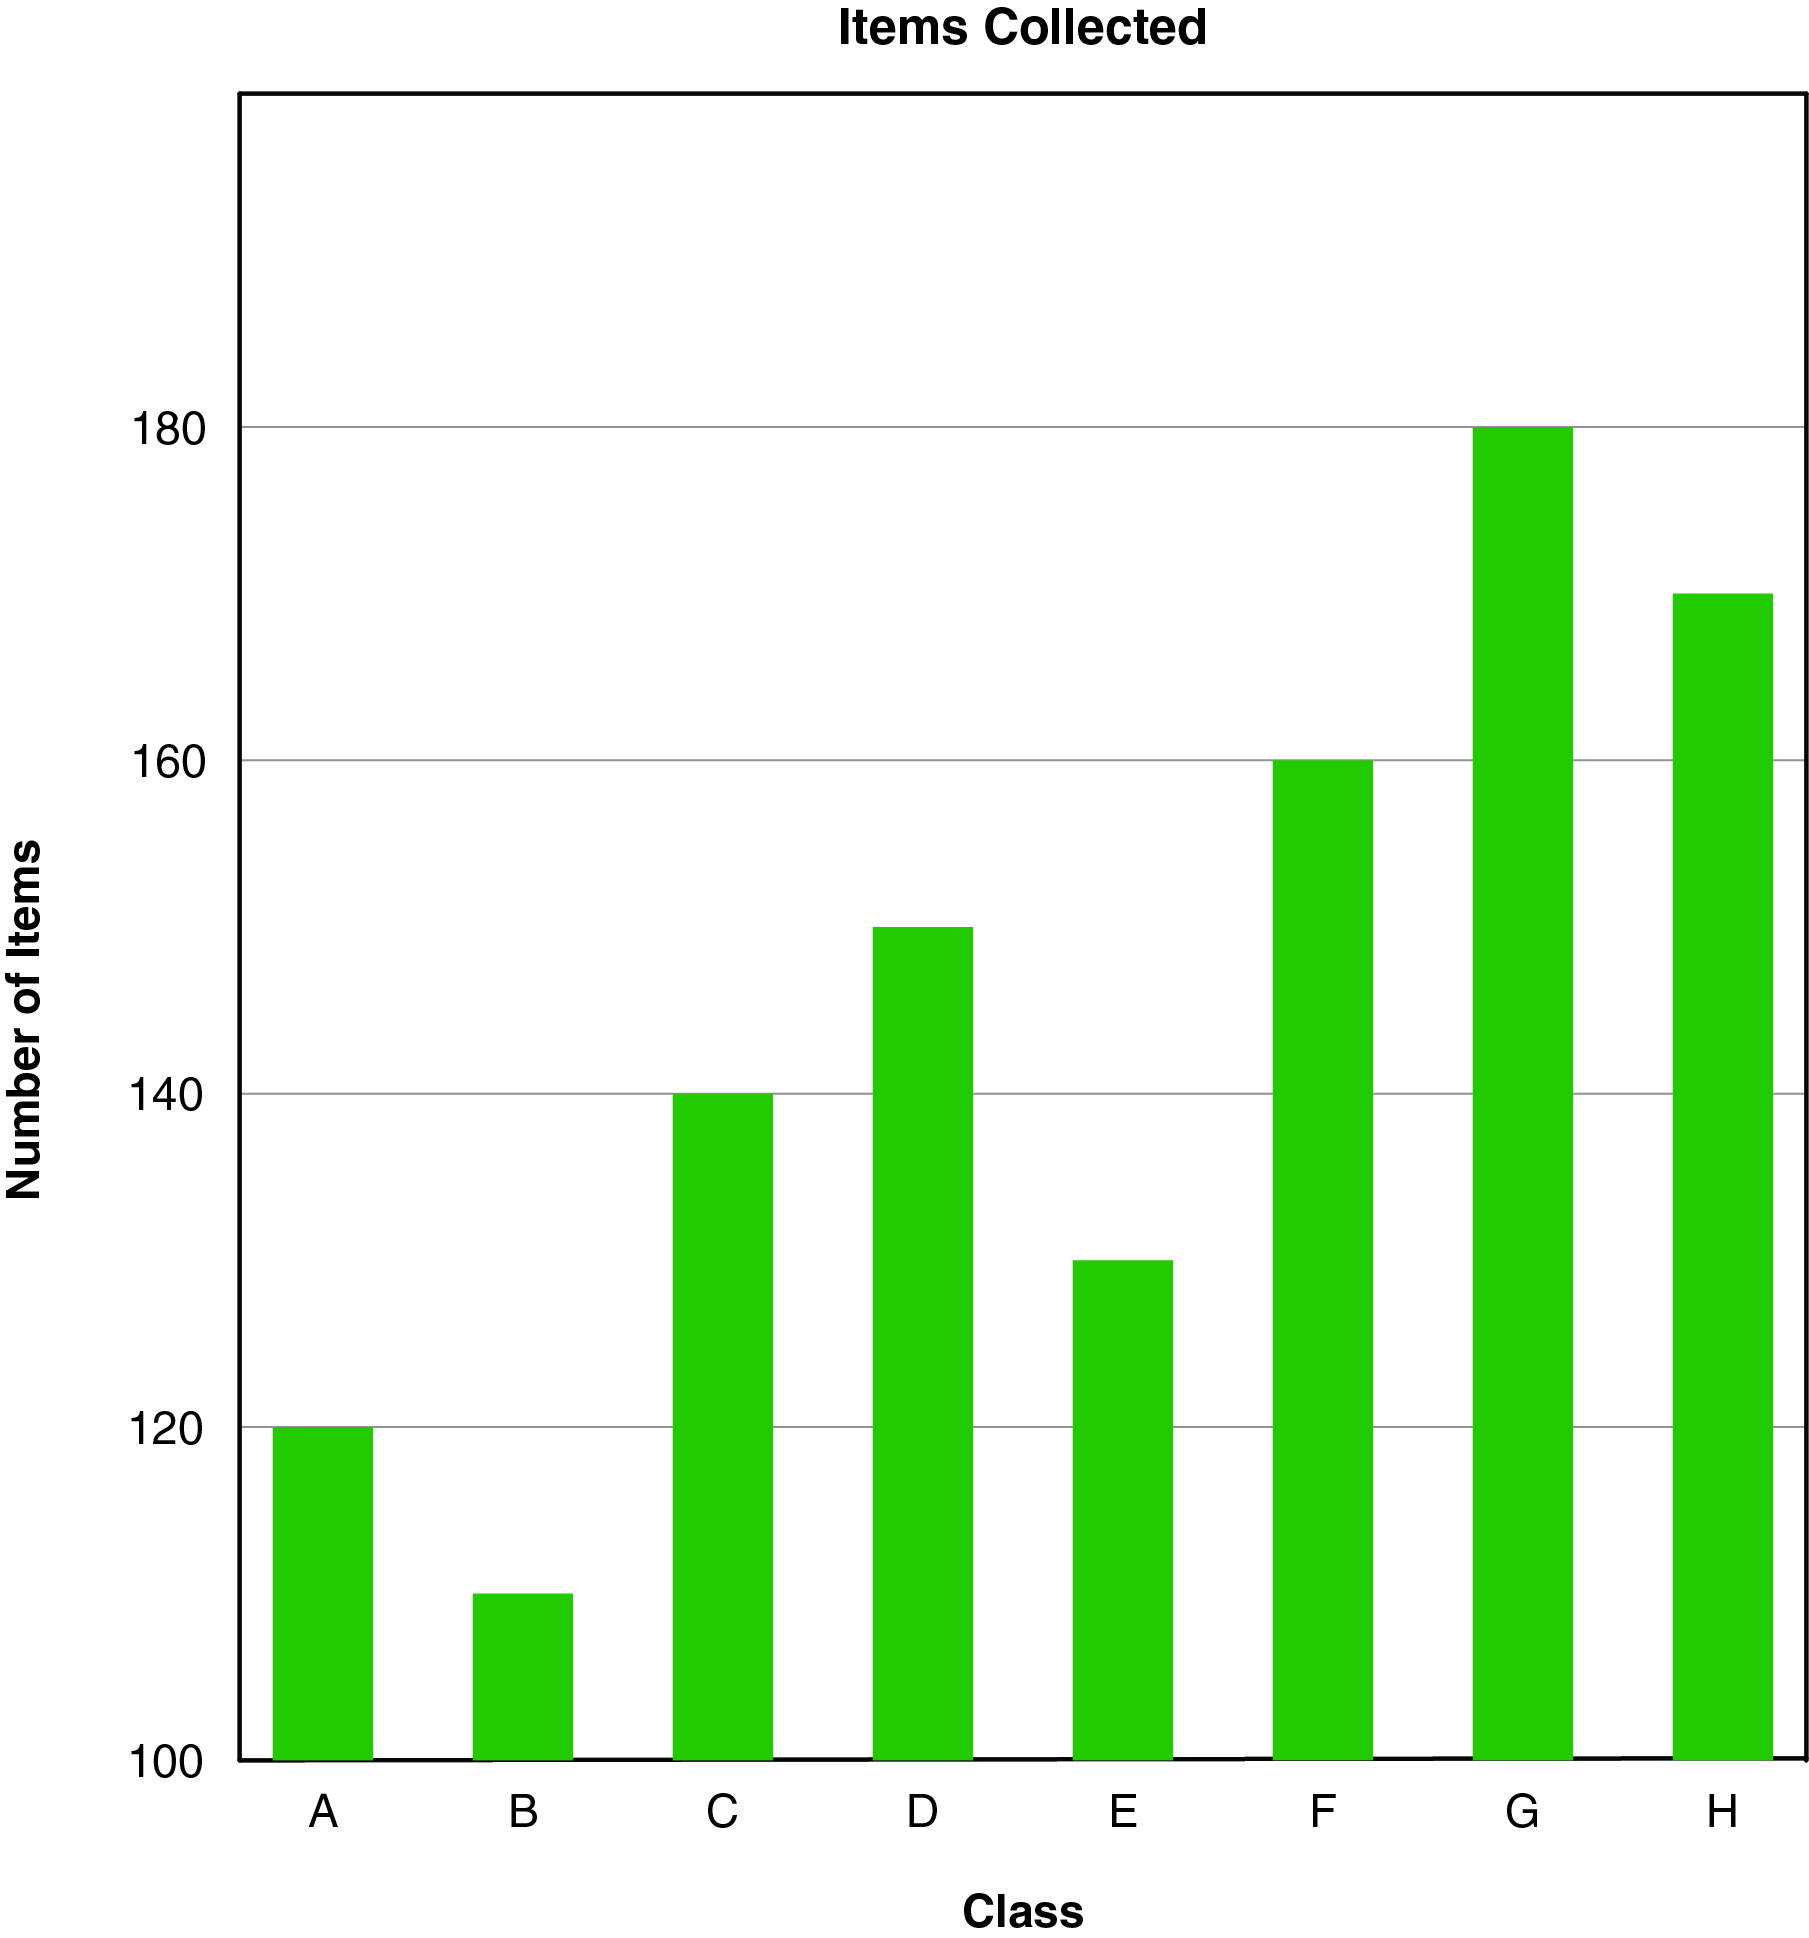
37. Question
The bar chart shows the number of items collected for a charity drive. What is the total number of items collected for the three highest classes?
 CorrectIncorrect
 -
Question 38 of 75
38. Question
The data set represents the number of weekly pop-up ads for 12 families:
125, 145, 150, 130, 150, 120, 170, 165, 175, 145, 150, and 130.
Find the median.
CorrectIncorrect -
Question 39 of 75
39. Question
Find the range for the data set:
34, 45, 27, 29, 36, 60, 52, 48, 41, 65, 44, 50, 64, 58, 47, 31
CorrectIncorrect -
Question 40 of 75
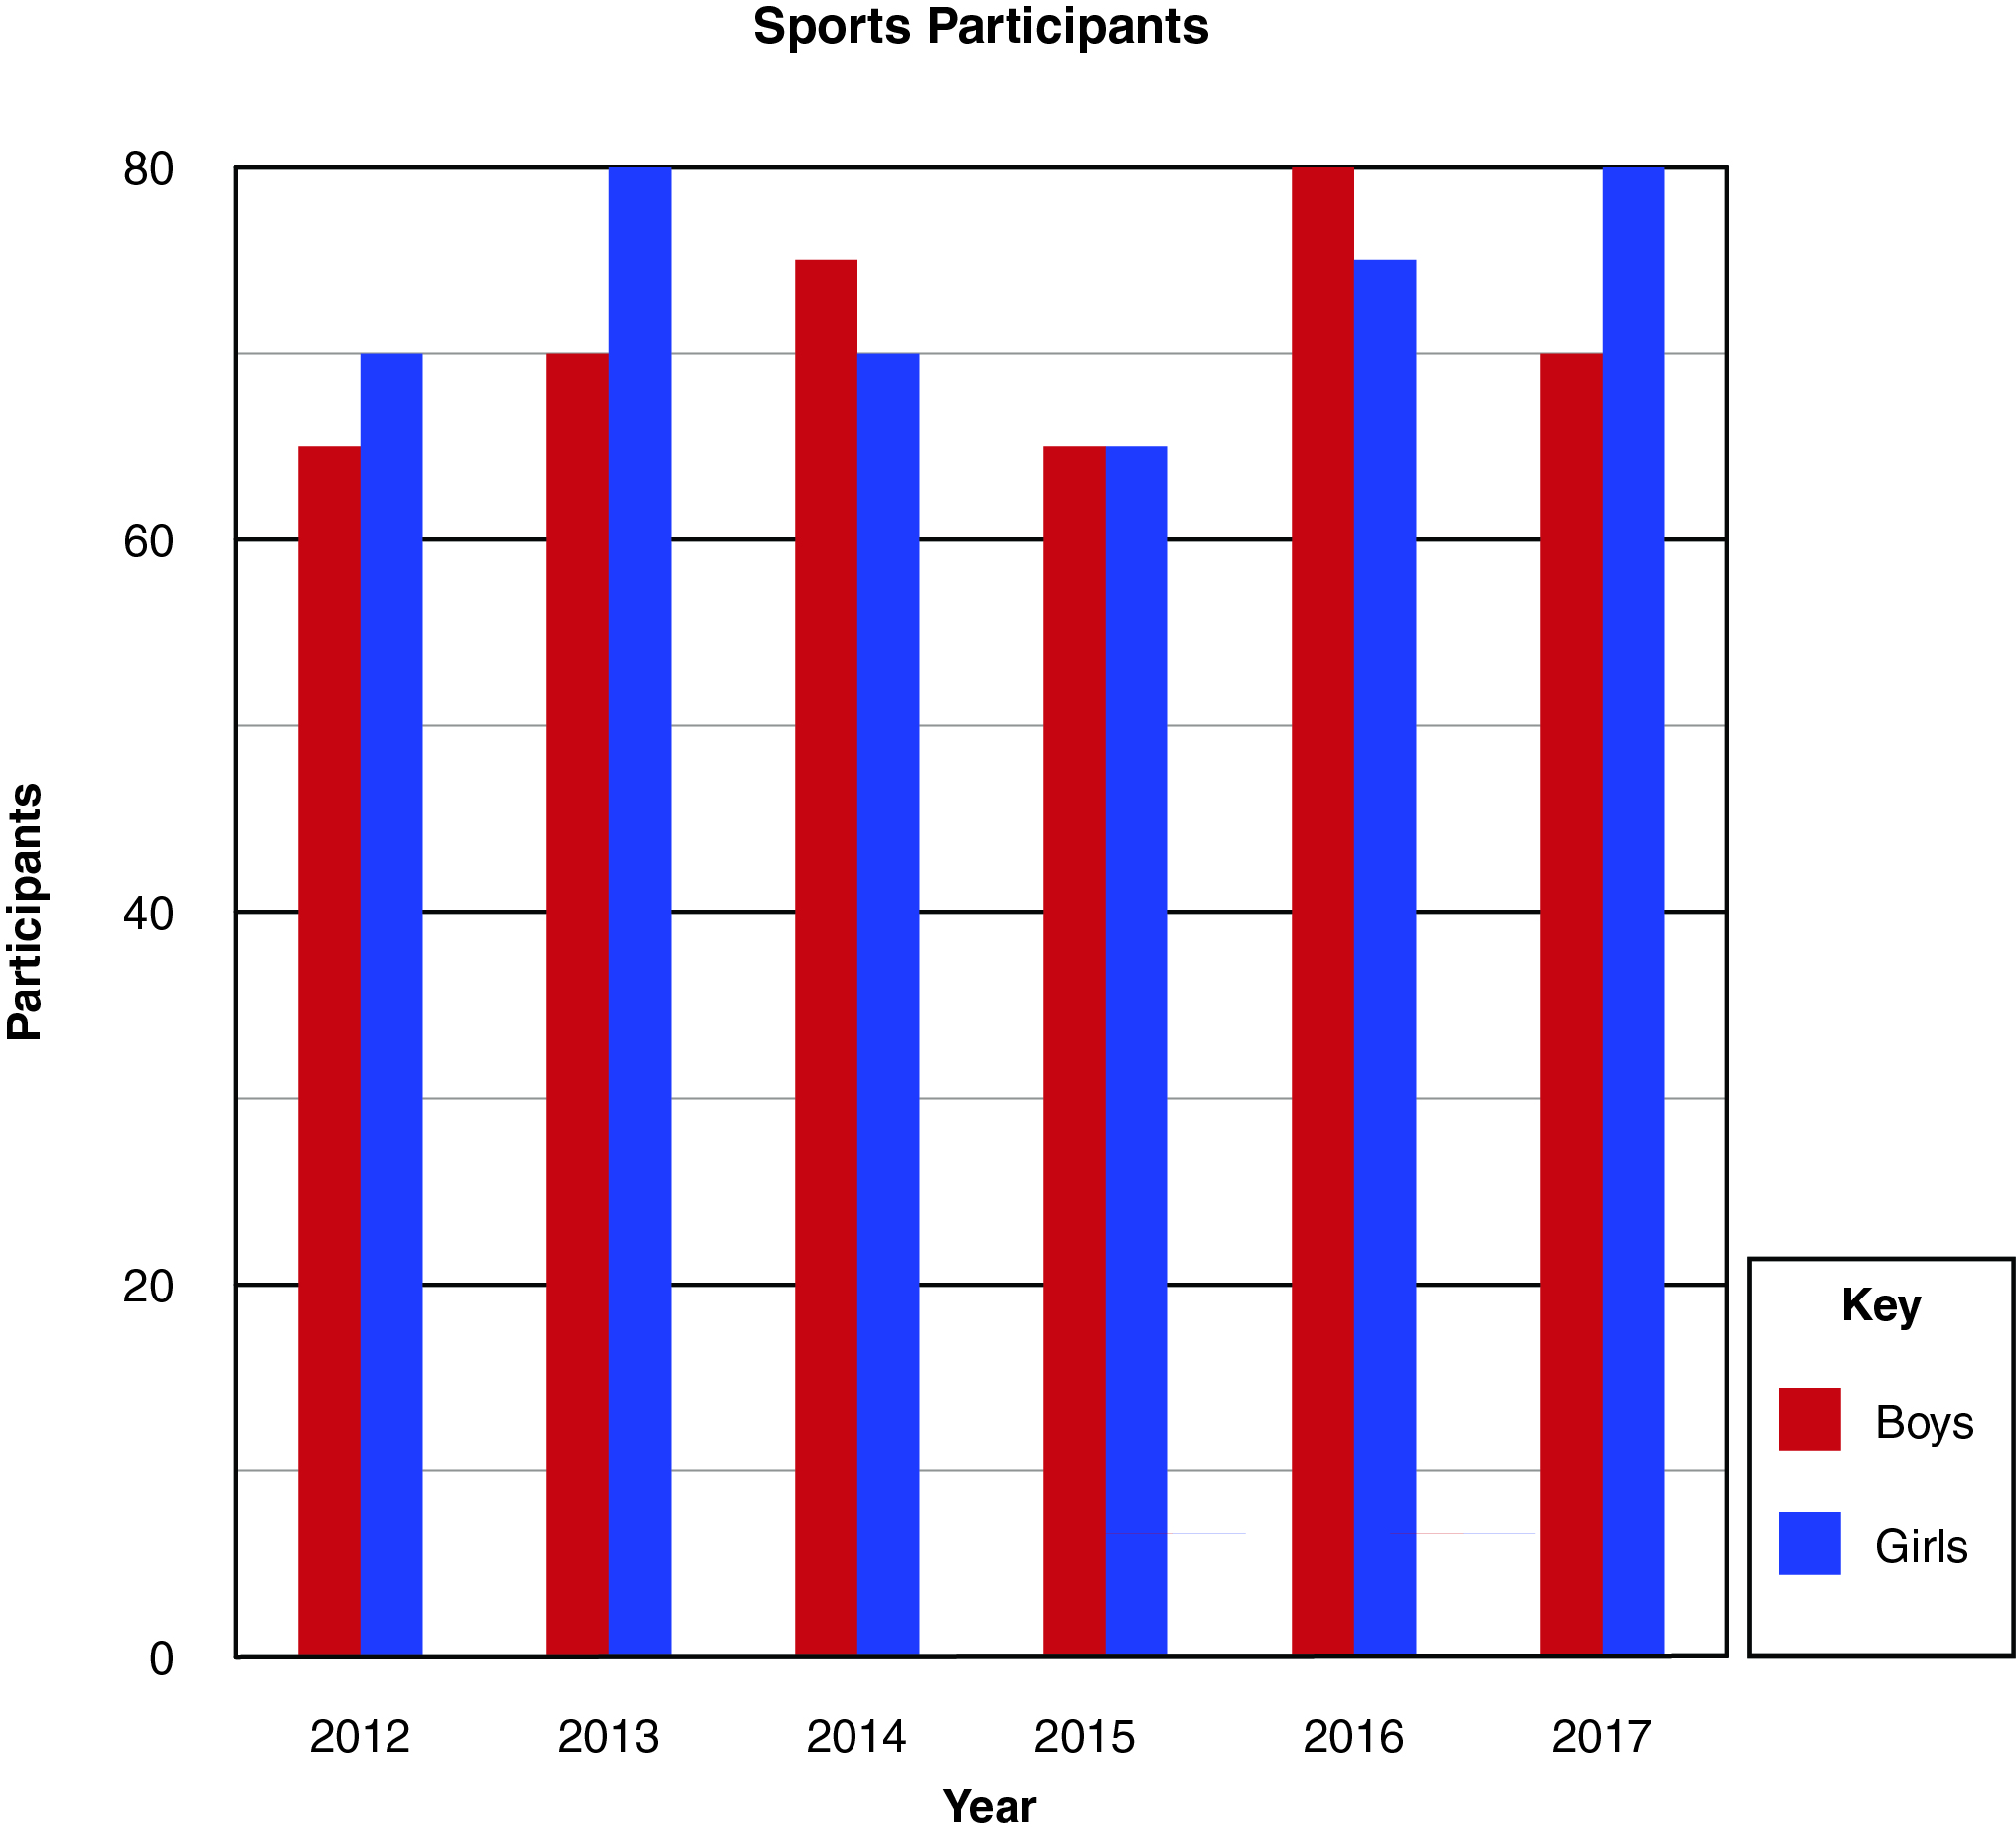
40. Question
The bar chart shows the number of boys and girls who participate in sports. What year had the most participants?
 CorrectIncorrect
 -
Question 41 of 75
41. Question
The table shows the speed in miles per hour of different roller coasters at an amusement park. Select the correct line graph for this data.
Amusement Park Roller Coasters
1
2
3
4
5
6
7
8
Speed (miles per hour)
120
105
75
100
60
85
110
90
CorrectIncorrect -
Question 42 of 75
42. Question
A gymnastics team has the following scores for an event:
12.3, 12.7, 14.1, 14.5, 13.8, 13.6, 14.2, 15.2, 14.8, 13.9, 15.4, 14.3
Find the mean score for the team to the nearest hundredth.
CorrectIncorrect -
Question 43 of 75
43. Question
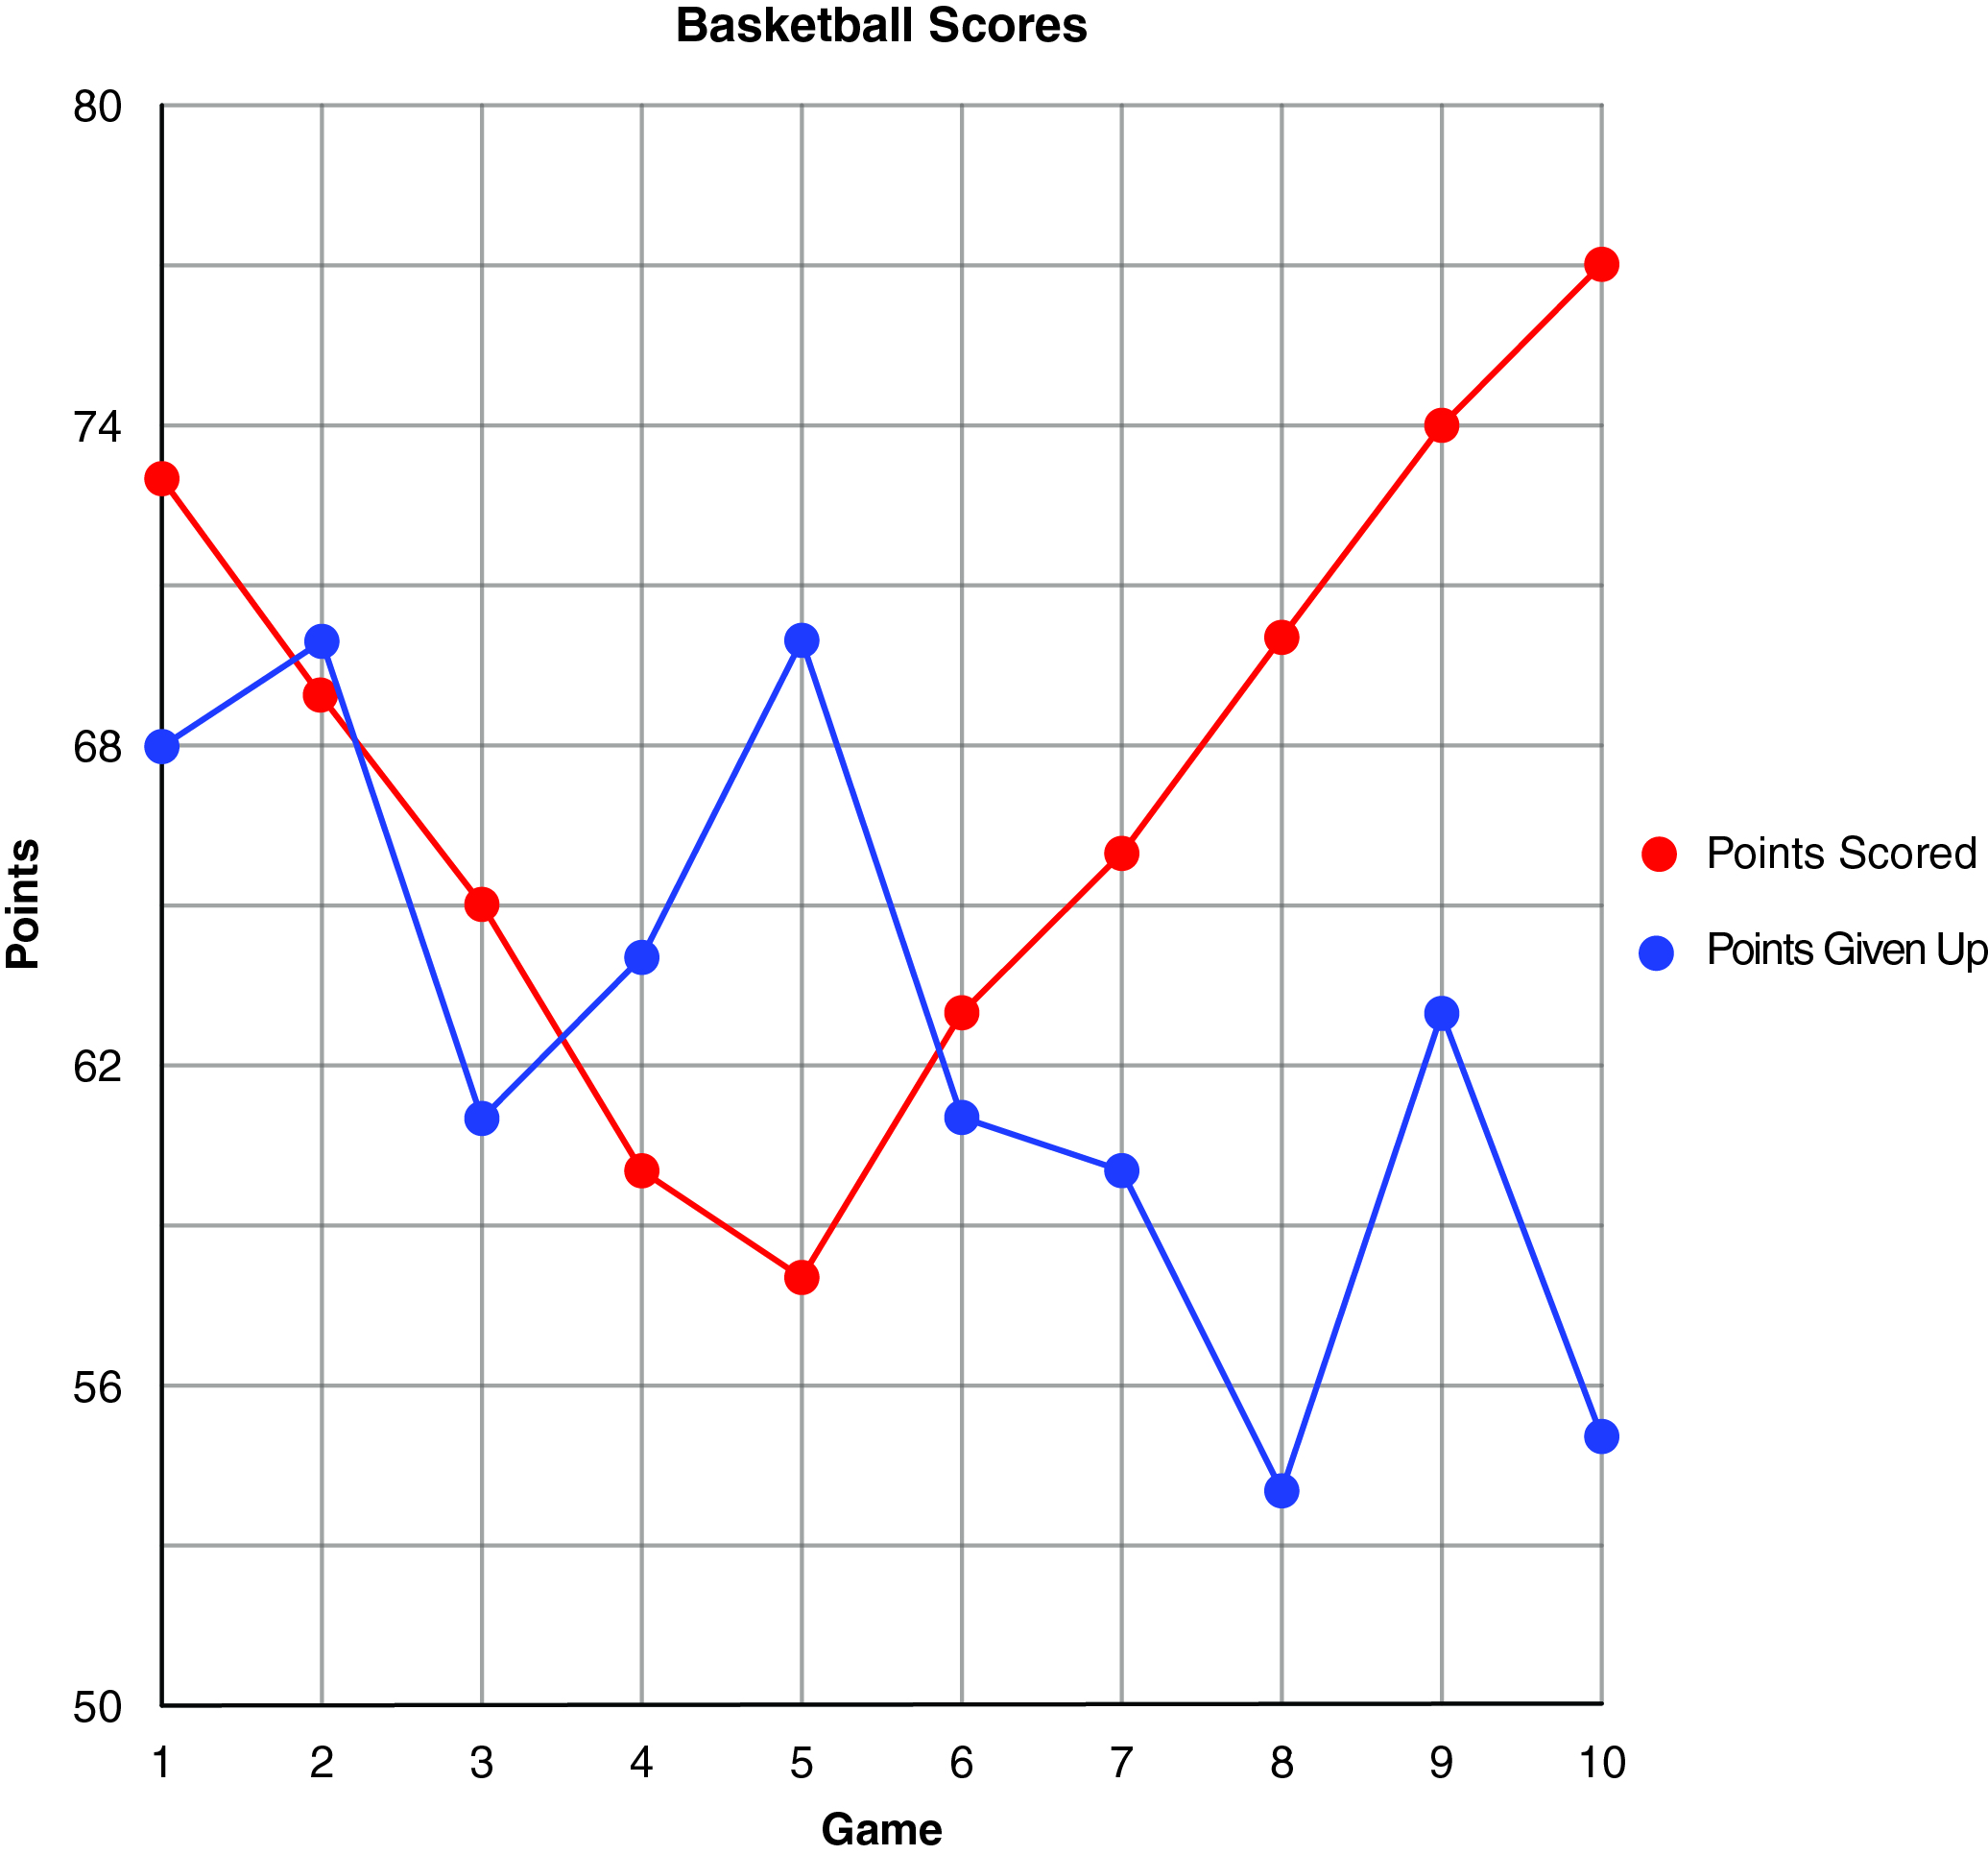
The double line chart shows the number of points scored and points given up by a basketball team over the first 10 games. Which statement is true?
 CorrectIncorrect
 -
Question 44 of 75
44. Question
The table shows the number of students in grades kindergarten through sixth grade. Select the correct bar graph for this data.
Grade
Kindergarten
1
2
3
4
5
6
Number of Students
135
150
140
155
145
165
170
CorrectIncorrect -
Question 45 of 75
45. Question
A mixture for a cake has various parts. Select the correct circle graph for the data.
Part
Eggs
Water
Oil
Mixture
Vanilla
Parts
2
3
2
7
1
CorrectIncorrect -
Question 46 of 75
46. Question
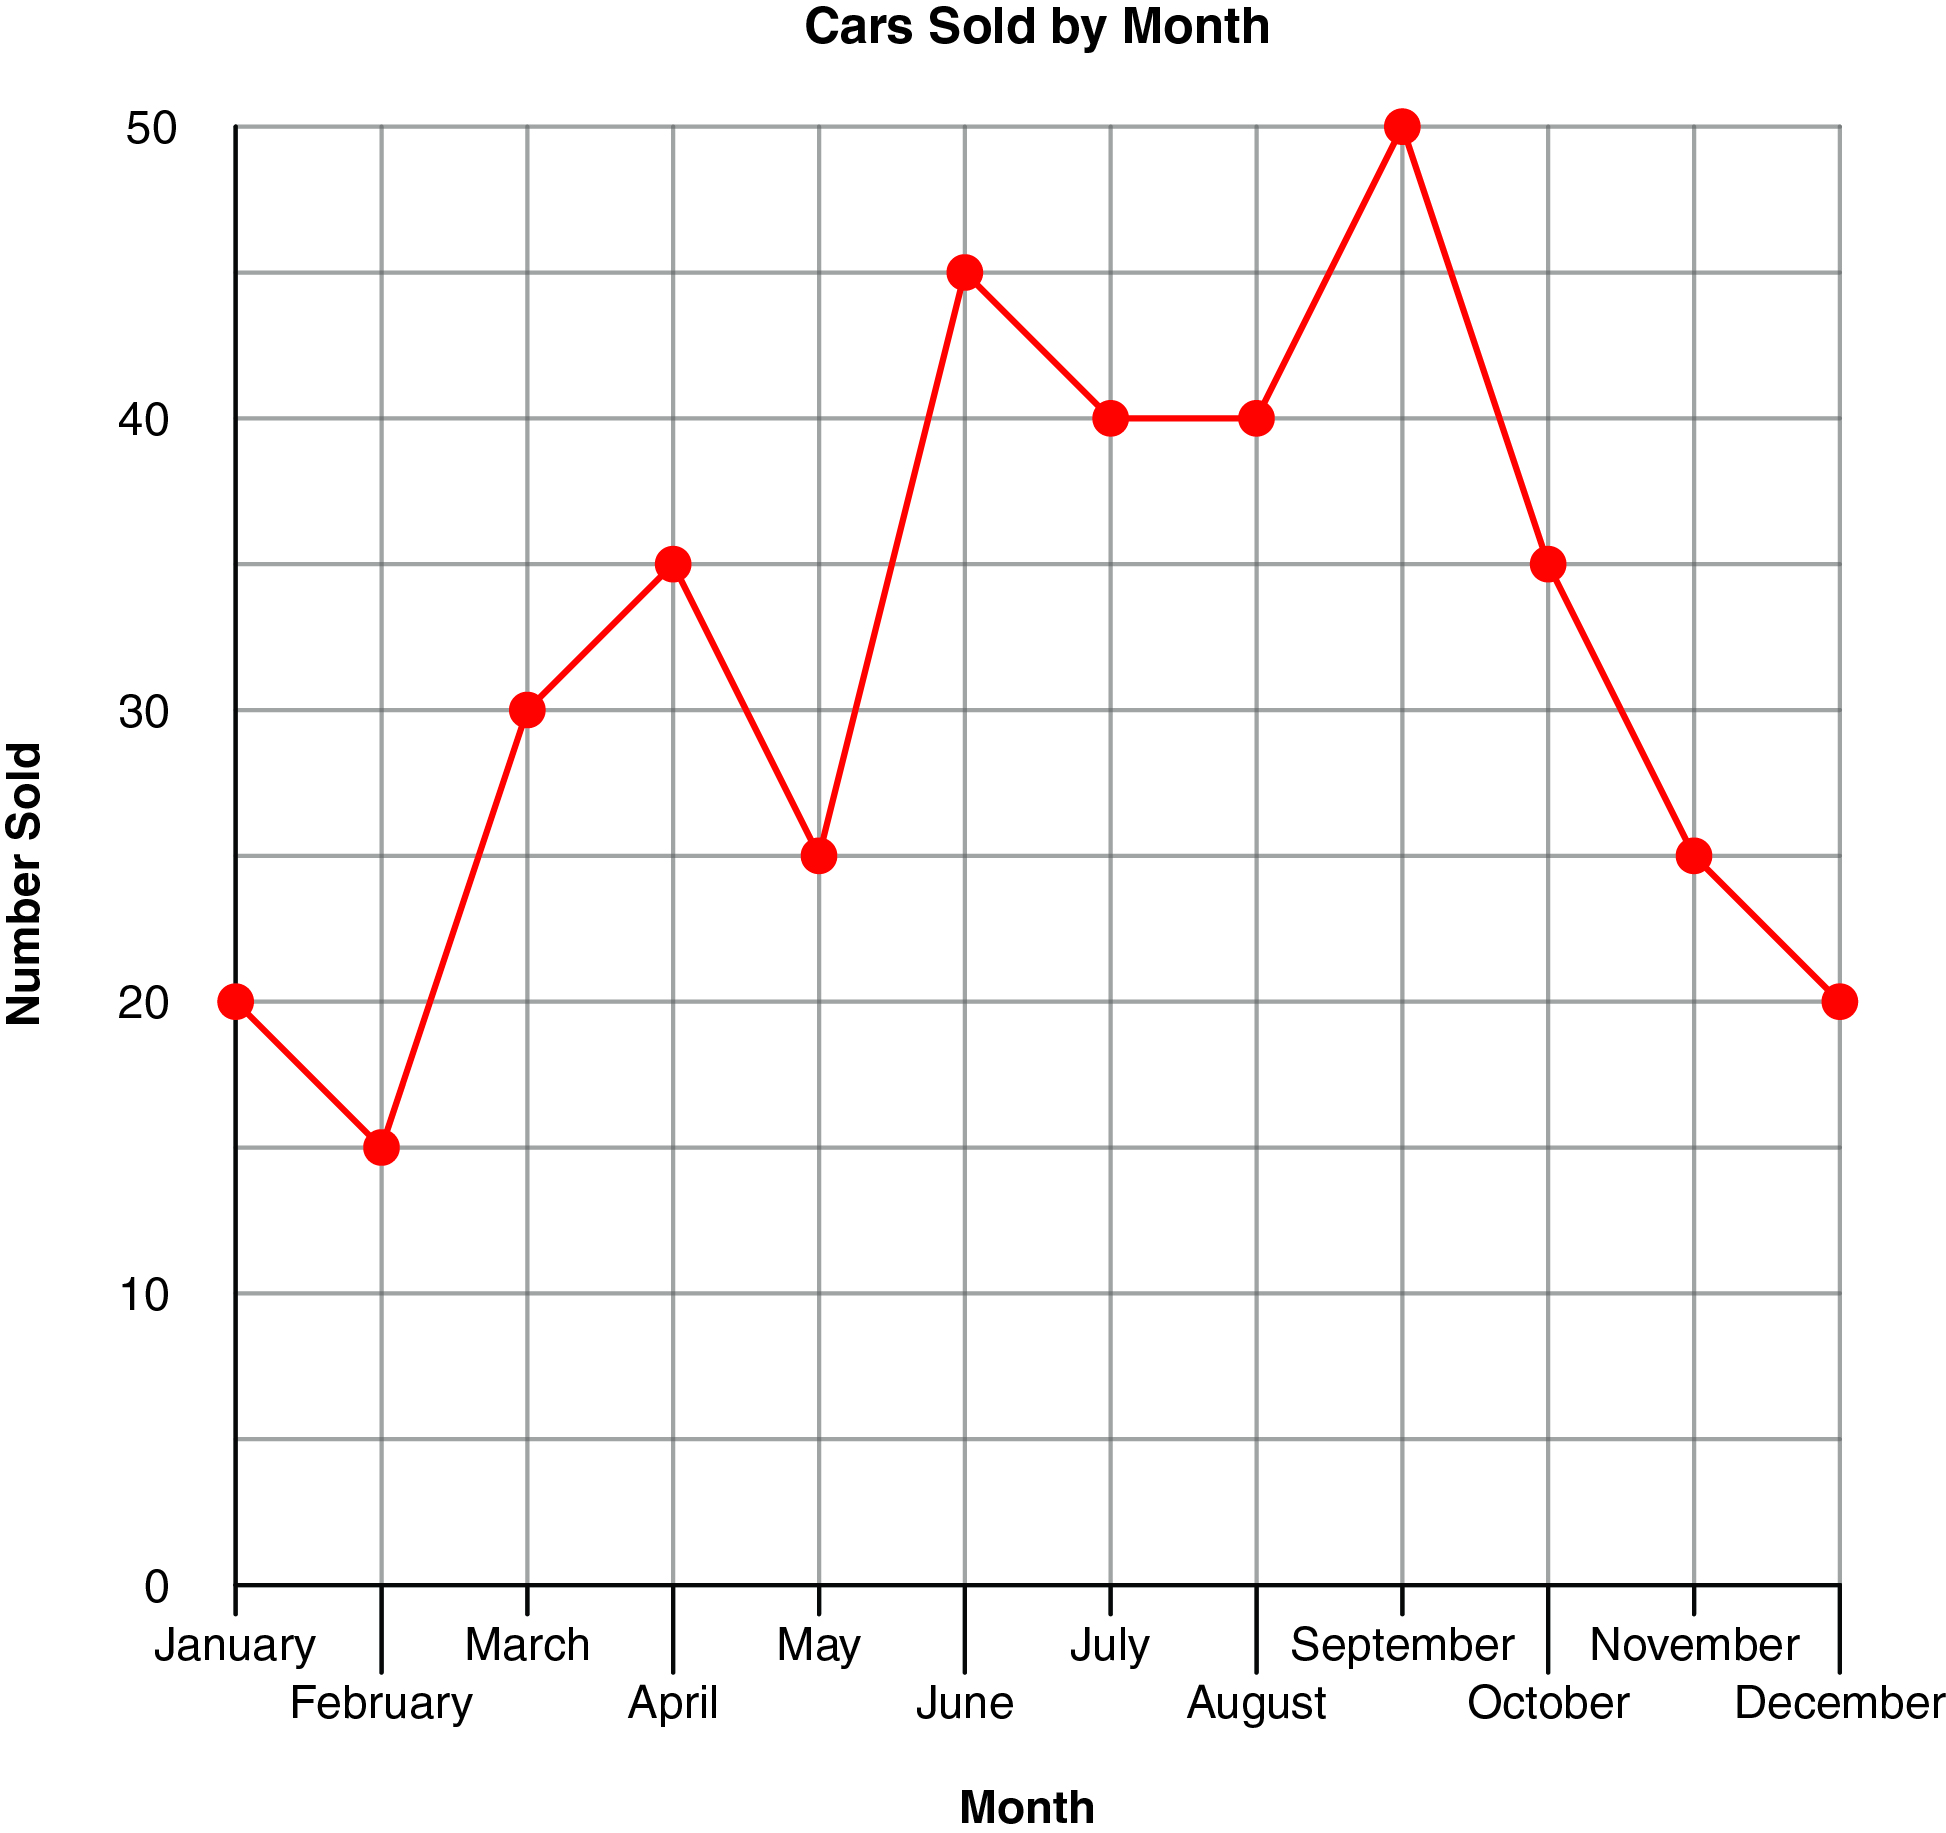
The line chart shows the number of cars sold each month. Which statement is true?
 CorrectIncorrect
 -
Question 47 of 75
47. Question
The bar chart shows the number of items collected for a charity drive. Which statement is true for the bar chart?
CorrectIncorrect -
Question 48 of 75
48. Question
A college class had one group use a traditional textbook and another group use an online textbook. The attendance for the class was compared. Determine the independent variable.
CorrectIncorrect -
Question 49 of 75
49. Question
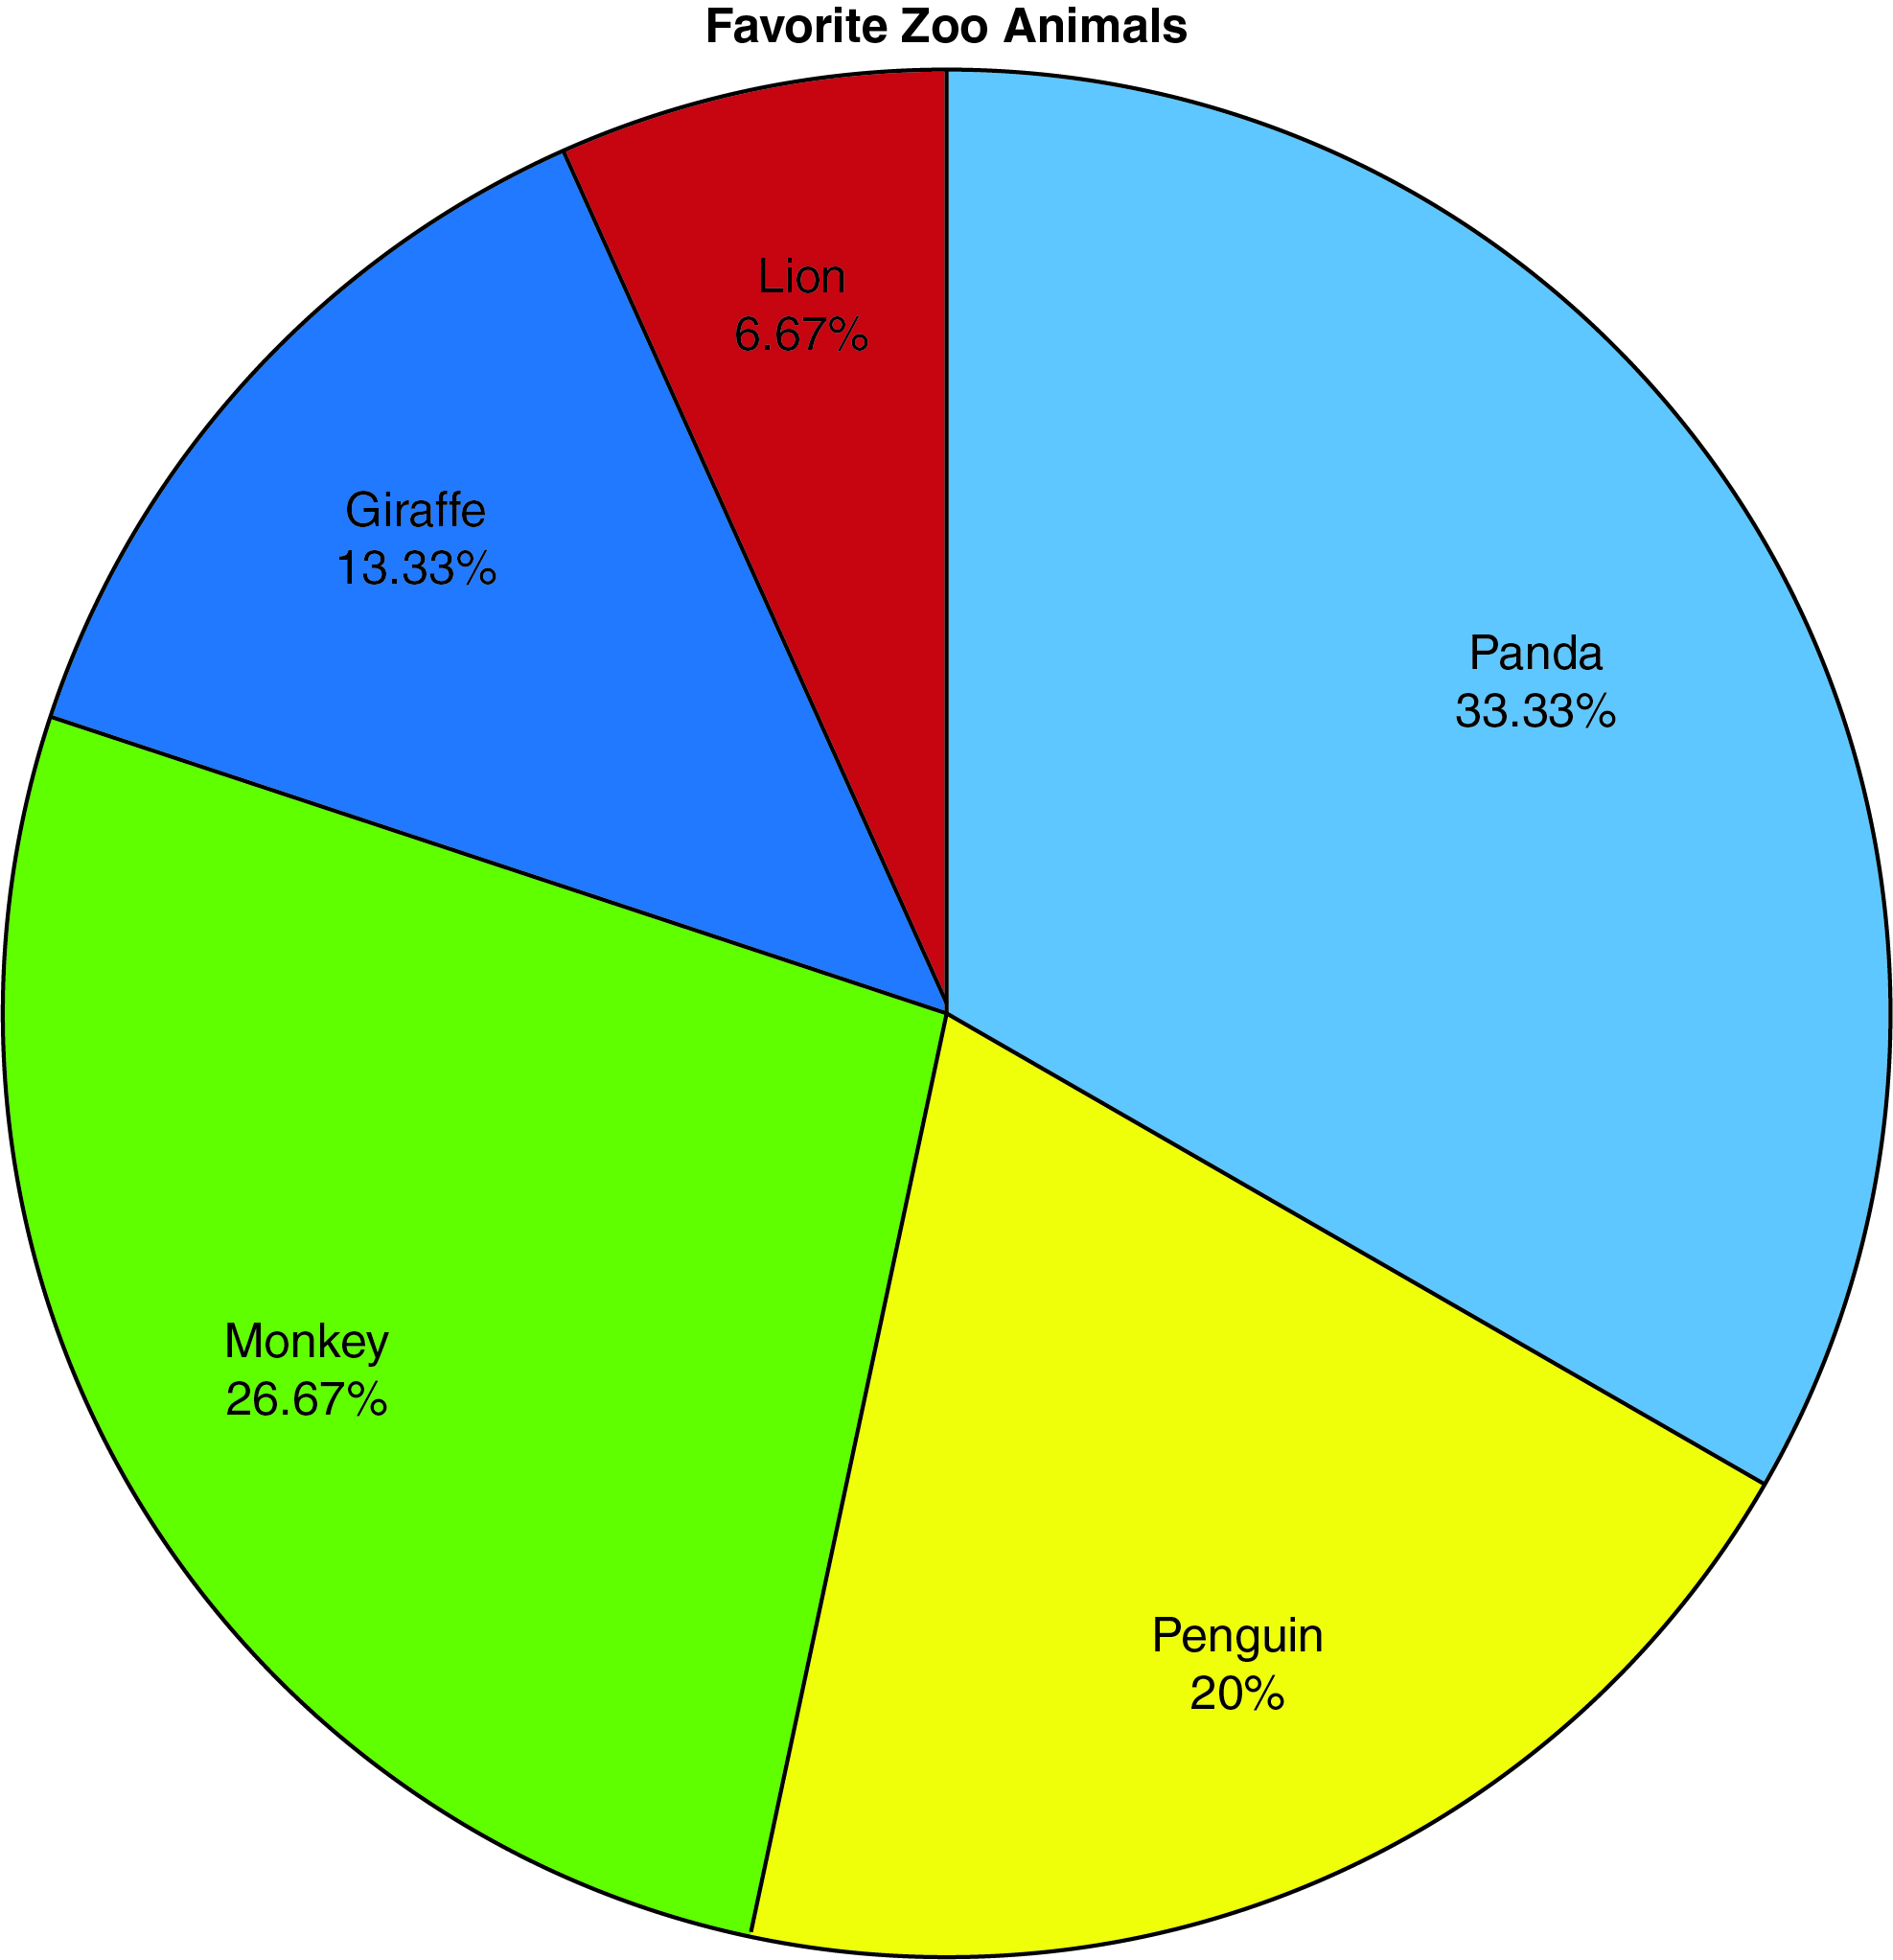
Elementary school students were surveyed about their favorite animals at a zoo. The circle graph shows the results. Which statement is true for the circle graph?
 CorrectIncorrect
 -
Question 50 of 75
50. Question
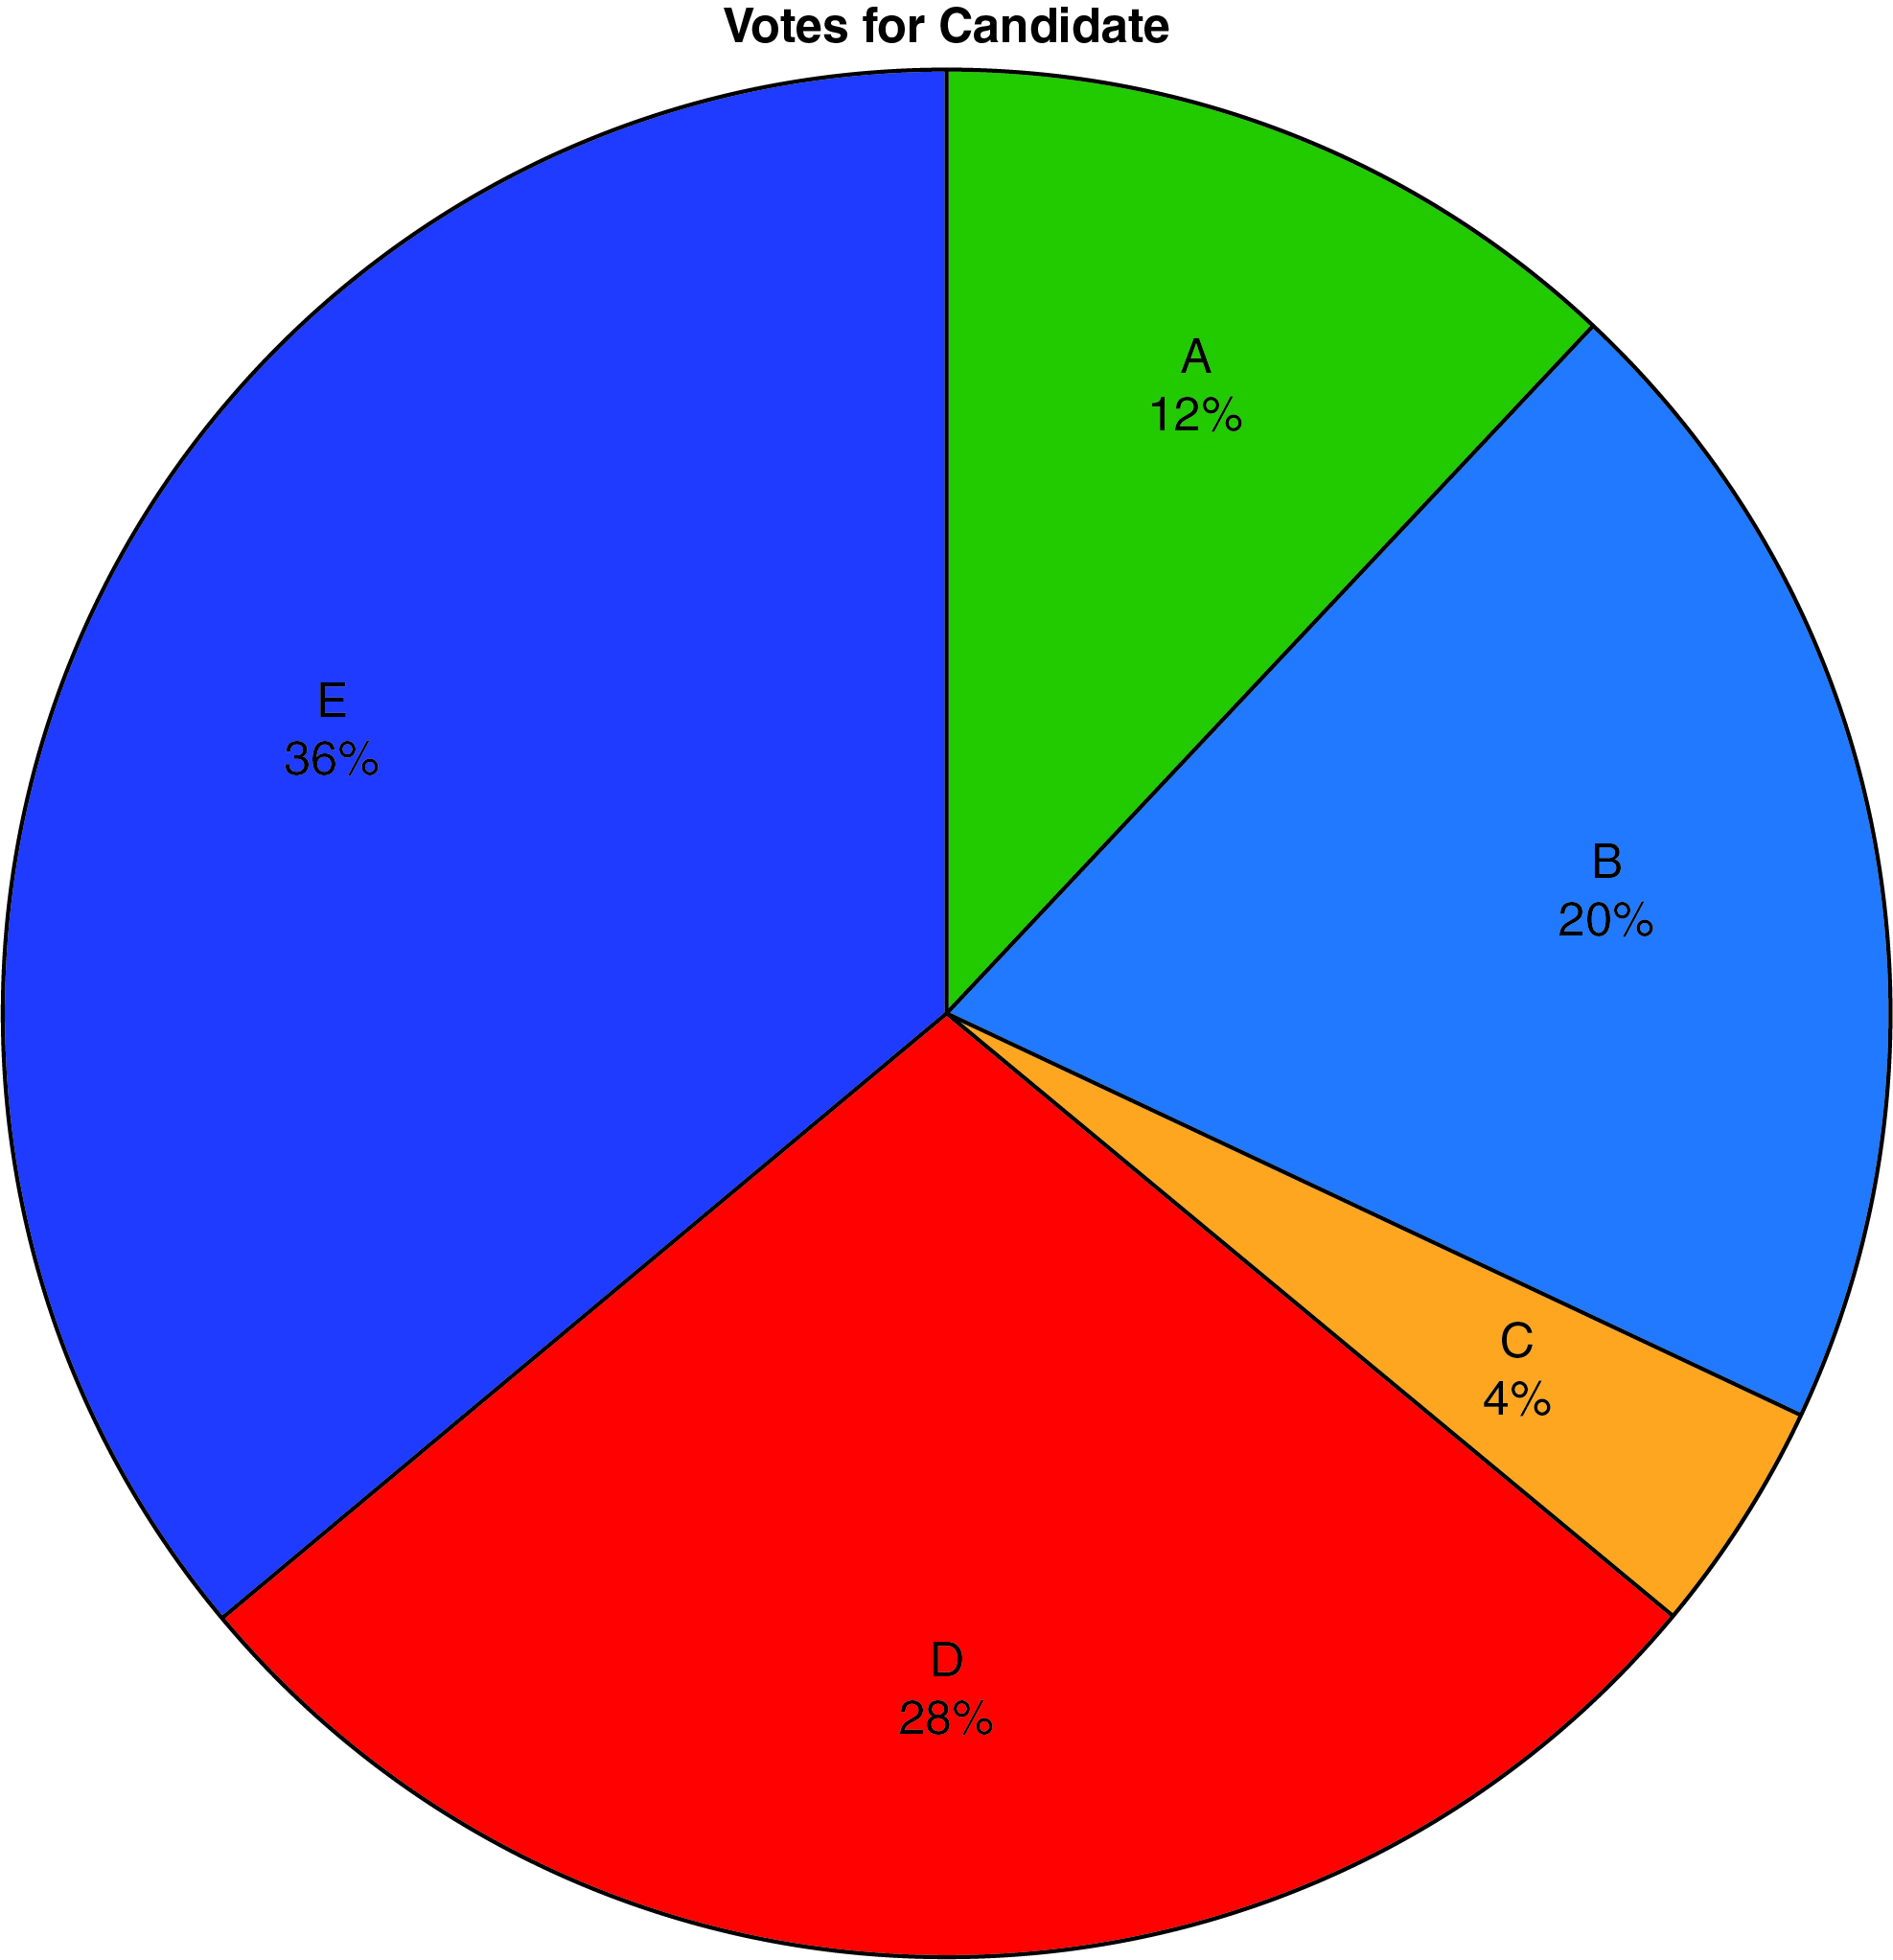
The circle graph shows the number of votes for each candidate. How many votes were cast for candidate D if there were 25,000 voters?
 CorrectIncorrect
 -
Question 51 of 75
51. Question
The table shows the temperature in Fahrenheit degrees for two cities the first ten days of December. Select the correct line graph for this data.
Day
1
2
3
4
5
6
7
8
9
10
City 1
25
18
34
29
32
26
19
15
12
7
City 2
14
20
22
18
20
18
14
9
8
11
CorrectIncorrect -
Question 52 of 75
52. Question
The mean of eight numbers is 71. The numbers in the data set are 72, 75, 64, 80, 79, and 68. What is the other number in the data set if the number is the mode of the set?
CorrectIncorrect -
Question 53 of 75
53. Question
The table shows the weight of 100 laptops. Find the mean weight to the nearest hundredth of a pound.
Weight
Quantity
3 pounds
35
4 pounds
24
5 pounds
19
6 pounds
11
7 pounds
11
CorrectIncorrect -
Question 54 of 75
54. Question
The double line chart shows the number of points scored and points given up by a basketball team over the first 10 games. How many games did the team win?
CorrectIncorrect -
Question 55 of 75
55. Question
A student takes several 10-point math quizzes during the year.
5, 7, 8, 6, 5, 6, 7, 8, 9, 7, 8, 10, 10, 9, 8, 7, 6, 8, 7, 9, 8, 10, 10, 9, 5, 7, 8, 9, 10, 7, 8, 9, 10
Find the mode score from the quizzes.
CorrectIncorrect -
Question 56 of 75
56. Question
The table shows the expenses and revenue for the first six months of a year in millions of dollars. Select the correct bar graph for this data.
Month
January
February
March
April
May
June
Revenue
5
4.5
6
6
6.5
7
Expenses
4
5
5.5
6
5
5.5
CorrectIncorrect -
Question 57 of 75
57. Question
A set of 8 numbers has 50 as the smallest number, and the median is 55. Which of the following sets could be the numbers?
CorrectIncorrect -
Question 58 of 75
58. Question
The circle graph shows the daily activities of a student. Which statement is true for the circle graph?
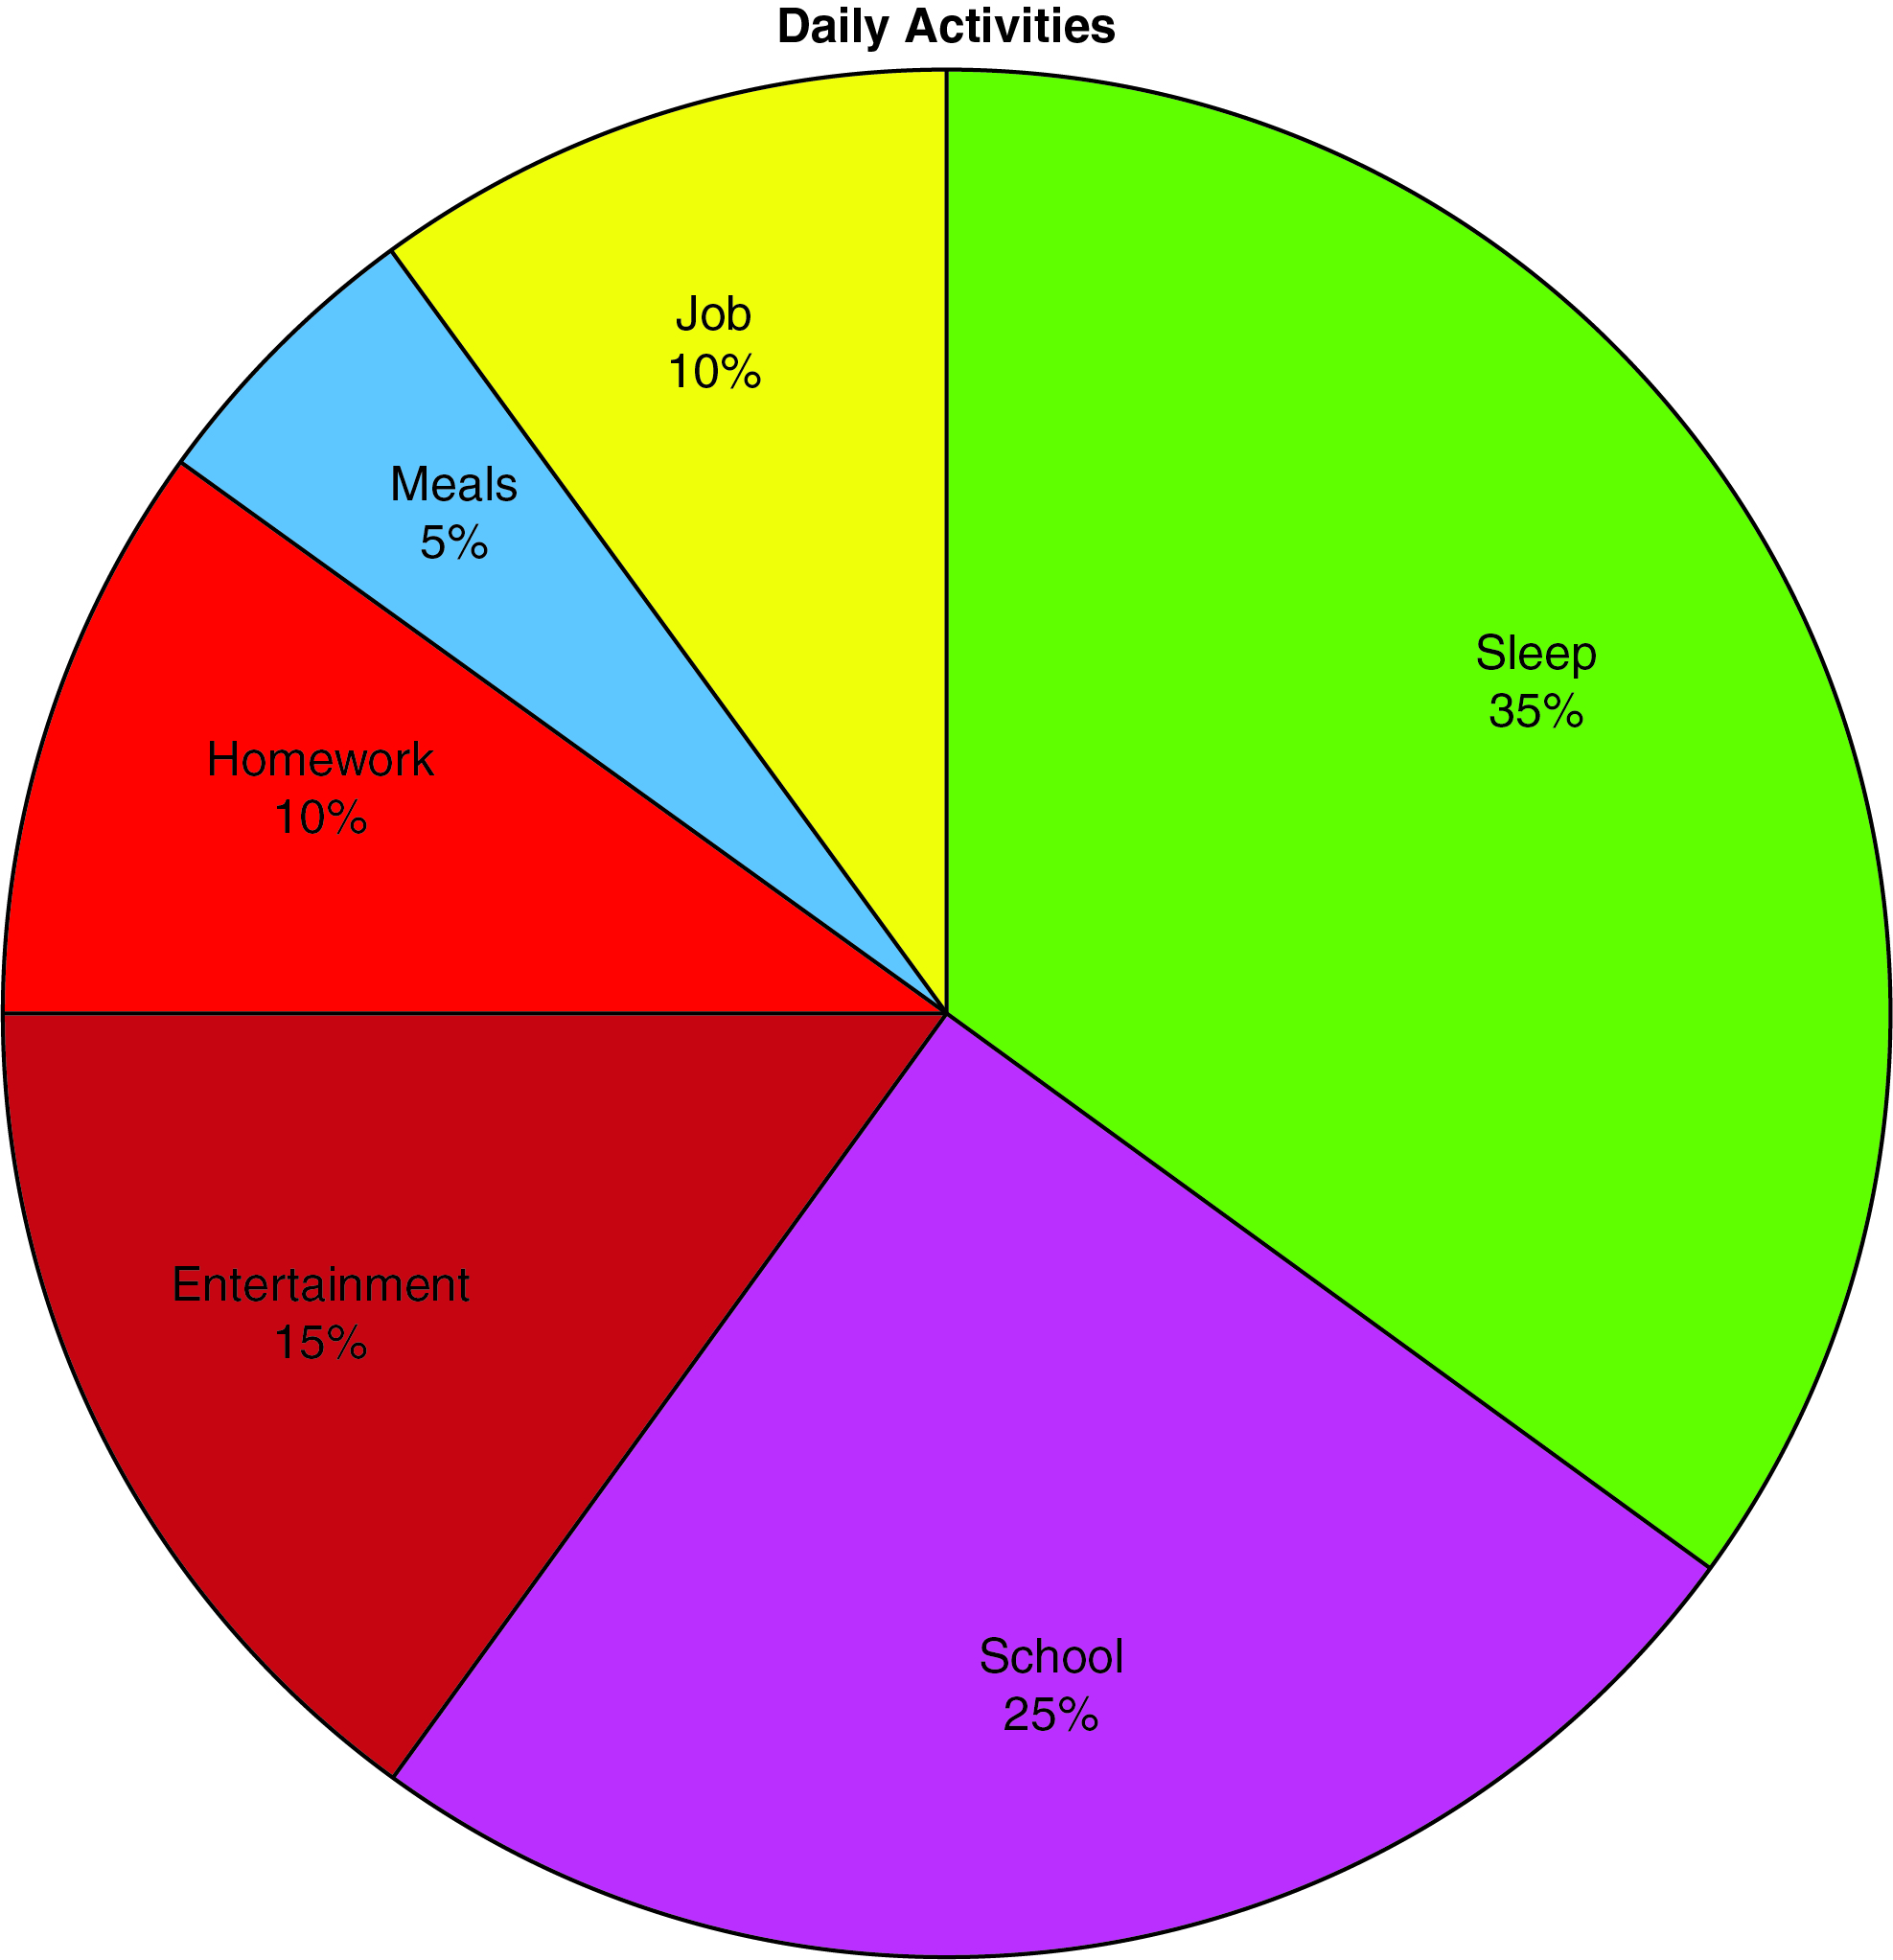 CorrectIncorrect
 -
Question 59 of 75
59. Question
The line chart shows the number of cars sold each month. Which month shows the greatest gain?
CorrectIncorrect -
Question 60 of 75
60. Question
The bar chart shows the number of boys and girls who participate in sports. What is the greatest difference between numbers of participants in any year?
CorrectIncorrect -
Question 61 of 75
61. Question
The number of service upgrades is shown for 20 employees.
10, 12, 11, 10, 13, 16, 12, 14, 18, 17, 15, 10, 19, 16, 11, 14, 15, 17, 18, 14
What is the median value of the data set?
CorrectIncorrect -
Question 62 of 75
62. Question
Elementary school teachers were told that children’s parents were high school graduates, did not complete college, or were college graduates. Then, the children’s grades were compared. Determine the dependent variable.
CorrectIncorrect -
Question 63 of 75
63. Question
The graph shows the amount of rainfall in inches for 12 days. Which statement is true for the line graph?
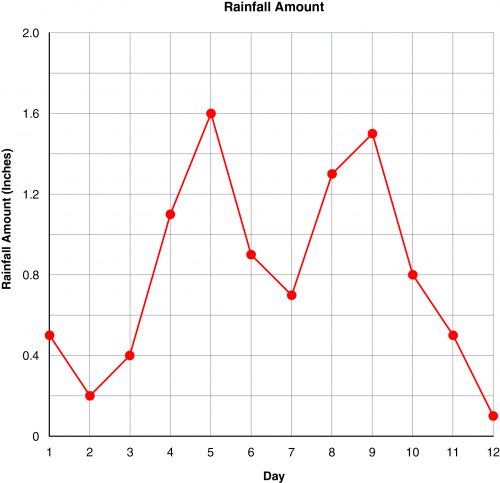 CorrectIncorrect
 -
Question 64 of 75
64. Question
What is the average amount of rainfall per day for the 12 days of data shown?
CorrectIncorrect -
Question 65 of 75
65. Question
The graph shows the amount of rainfall in inches for 12 days. Which statement is true for the line graph?
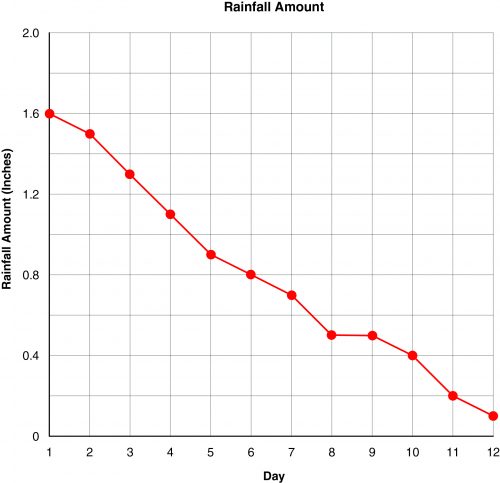 CorrectIncorrect
 -
Question 66 of 75
66. Question
What is the average amount of rainfall per day for the 12 days of data shown?
CorrectIncorrect -
Question 67 of 75
67. Question
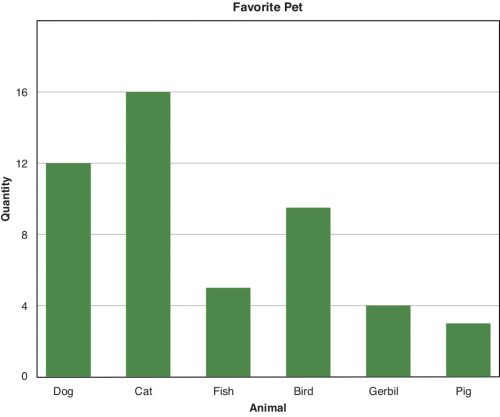
Students were surveyed about their favorite pet and the bar graph shows the results. Select the best statement for the bar graph.
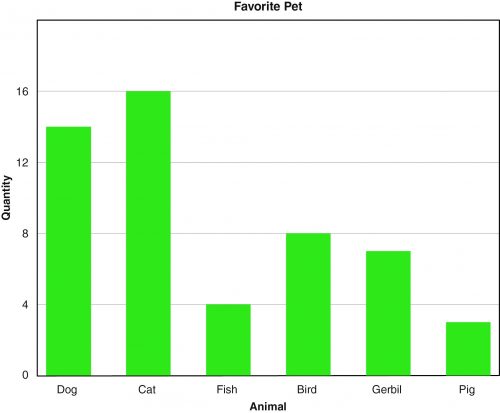 CorrectIncorrect
 -
Question 68 of 75
68. Question
Students were surveyed about their favorite pet and the bar graph shows the results. If each quantity were to represent 5 students, how many students were surveyed?
CorrectIncorrect -
Question 69 of 75
69. Question
The following circle graph shows what a family spends their income on each month. Select the correct statement for the circle graph.
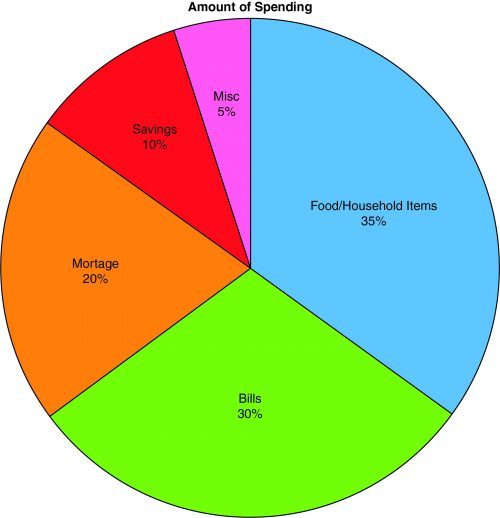 CorrectIncorrect
 -
Question 70 of 75
70. Question
The following circle graph shows what a family spends their income on each month. If the family earns $5,000 a month, how much money are they spending on their mortgage?
CorrectIncorrect -
Question 71 of 75
71. Question
Students were surveyed about their favorite pet and the bar graph shows the results. Select the best statement for the bar graph.
 CorrectIncorrect
 -
Question 72 of 75
72. Question
Students were surveyed about their favorite pet and the bar graph shows the results. If each quantity were to represent 3 students, how many students were surveyed?
CorrectIncorrect -
Question 73 of 75
73. Question
The following circle graph shows what a family spends their income on each month. Select the correct statement for the circle graph.
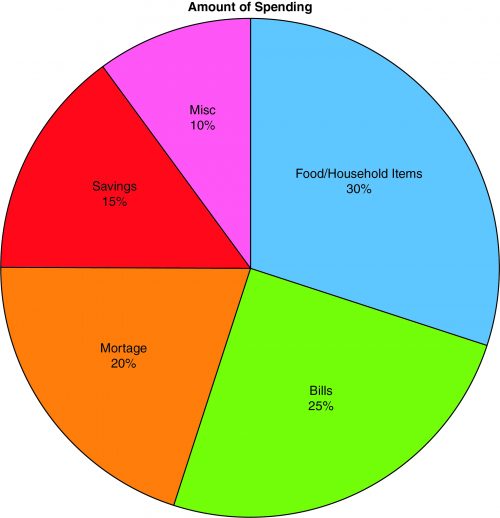 CorrectIncorrect
 -
Question 74 of 75
74. Question
The following circle graph shows what a family spends their income on each month. If the family earns $6,500 a month, how much money are they spending on their bills?
CorrectIncorrect -
Question 75 of 75
75. Question
Two companies have made a chart of paid time off. Which statement describes the median and interquartile range?
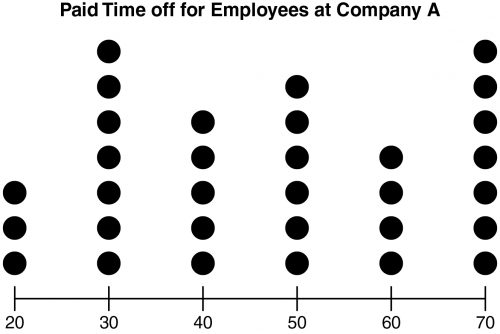
 CorrectIncorrect